
Did you know that GitHub maintains a public database of known CVEs and security advisories for open-source codebases?
The database is a public Git repository that holds JSON files in OSV format, partitioned by date.
This is the data that's displayed on the github.com/advisories page, which also powers Dependabot alerts!
Since it's just a Git repo, we wanted to take it for a spin with MergeStat to see what we could learn applying some SQL to its contents.
Setup
We followed the getting started instructions to get a new local instance of MergeStat running with docker-compose.
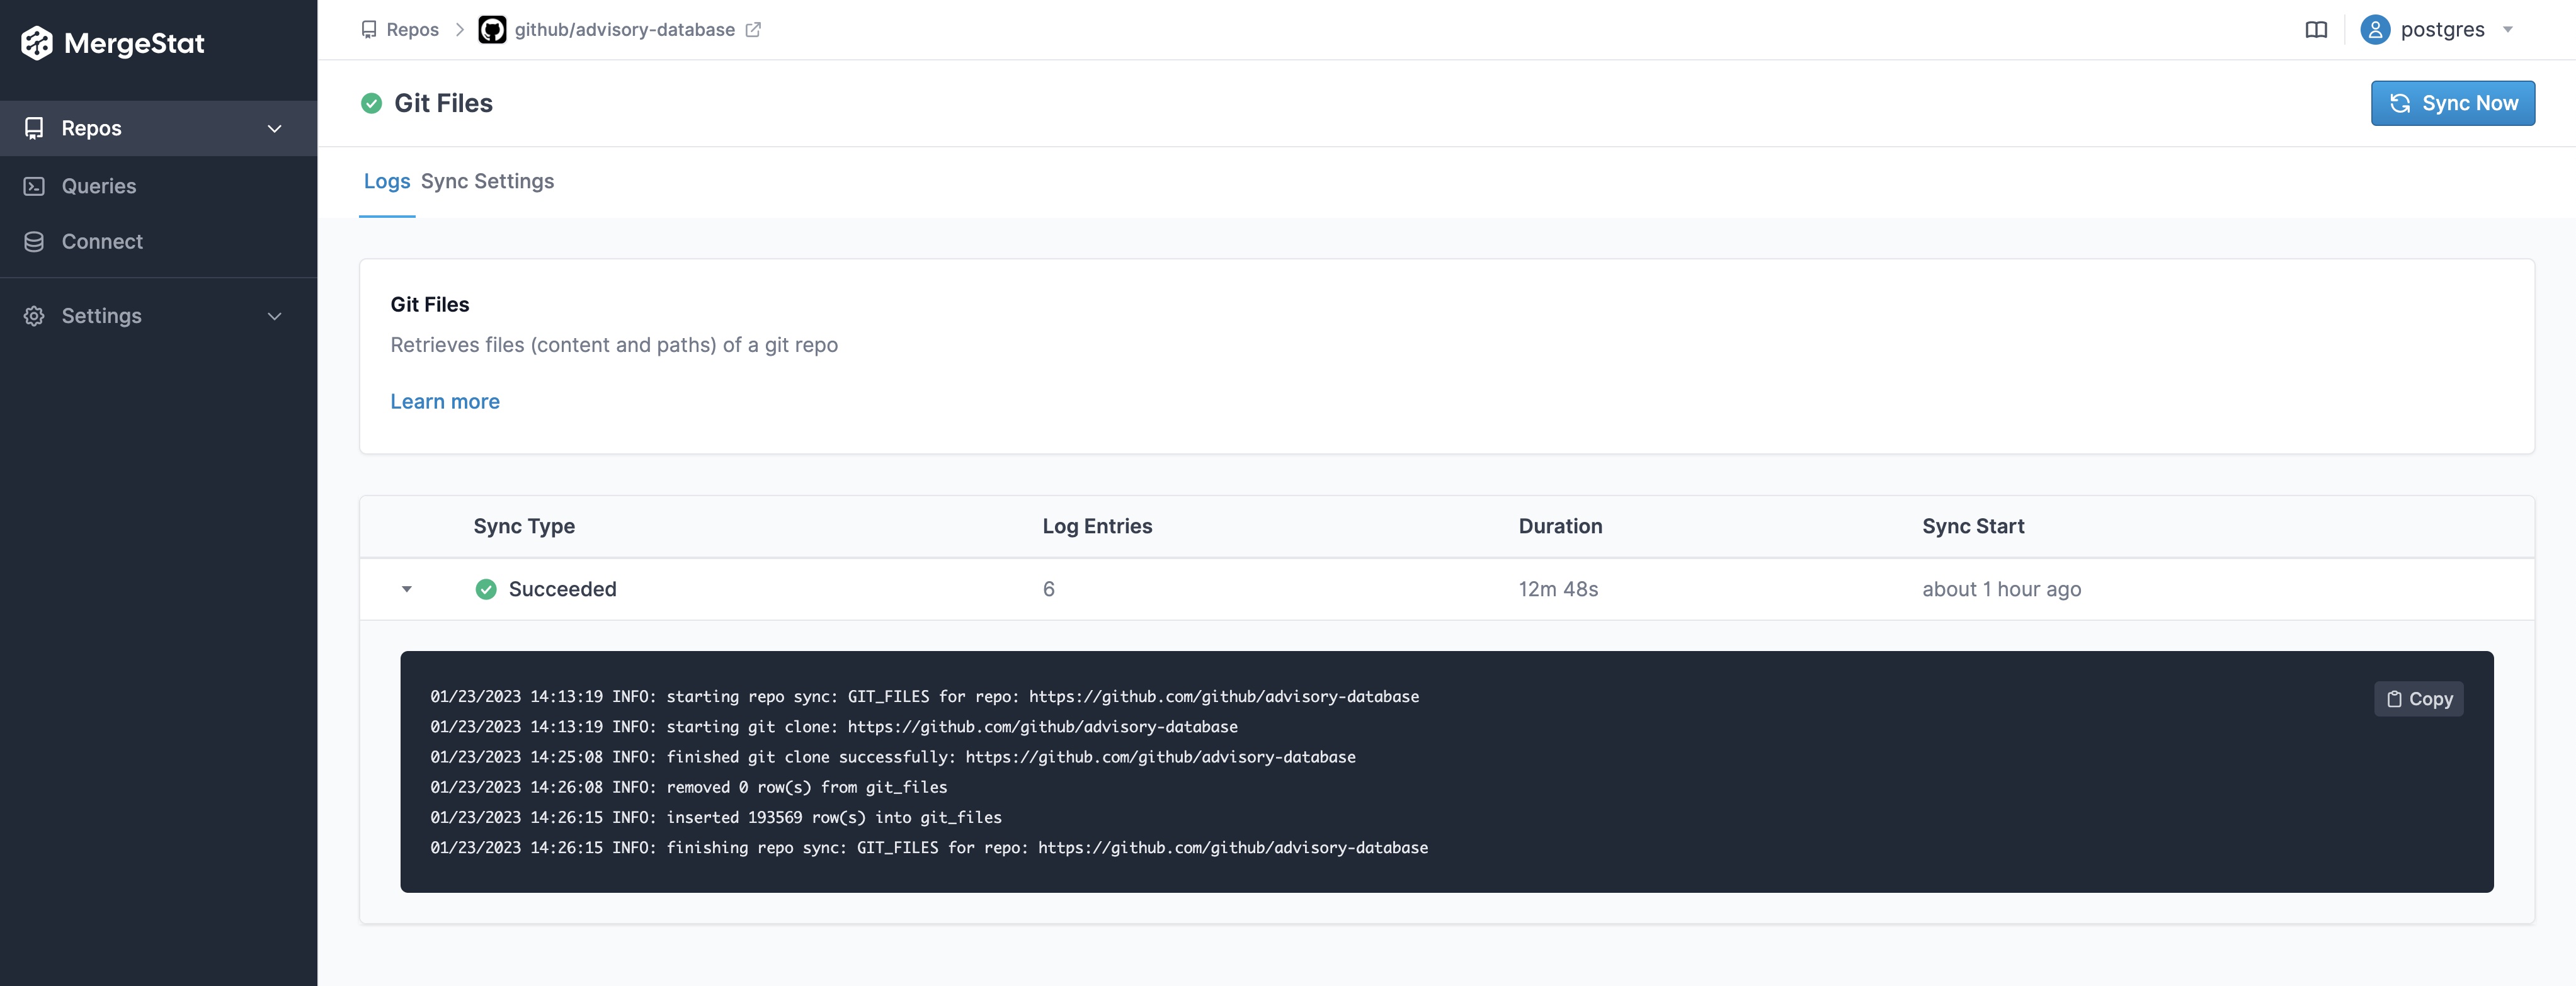
Since this is a public GitHub repo (and we're looking at the data brought in by the GIT_FILES syncer), we don't need to configure any authentication, we can just bring the repo in directly, and sync the file contents:
We started by establishing a view over the "raw" file contents of the repo, which extracts some values from the underlying JSON files and parses their file paths:
-- View of all GitHub Advisories in the repo
CREATE OR REPLACE VIEW github_advisories AS (
    SELECT
        path,
        split_part(path, '/', 2) as reviewed,
        split_part(path, '/', 3) as year,
        split_part(path, '/', 4) as month,
        split_part(path, '/', 5) as id,
        contents::jsonb->>'summary' as summary,
        contents::jsonb->'database_specific'->>'severity' as severity,
        a.value->'package'->'name' as affected_name,
        a.value->'package'->'ecosystem' as affected_ecosystem
    FROM git_files LEFT JOIN LATERAL jsonb_array_elements(contents::jsonb->'affected') a ON true
    WHERE path LIKE 'advisories/%.json'
)
This allows us to run much cleaner queries, such as:
SELECT * FROM github_advisories
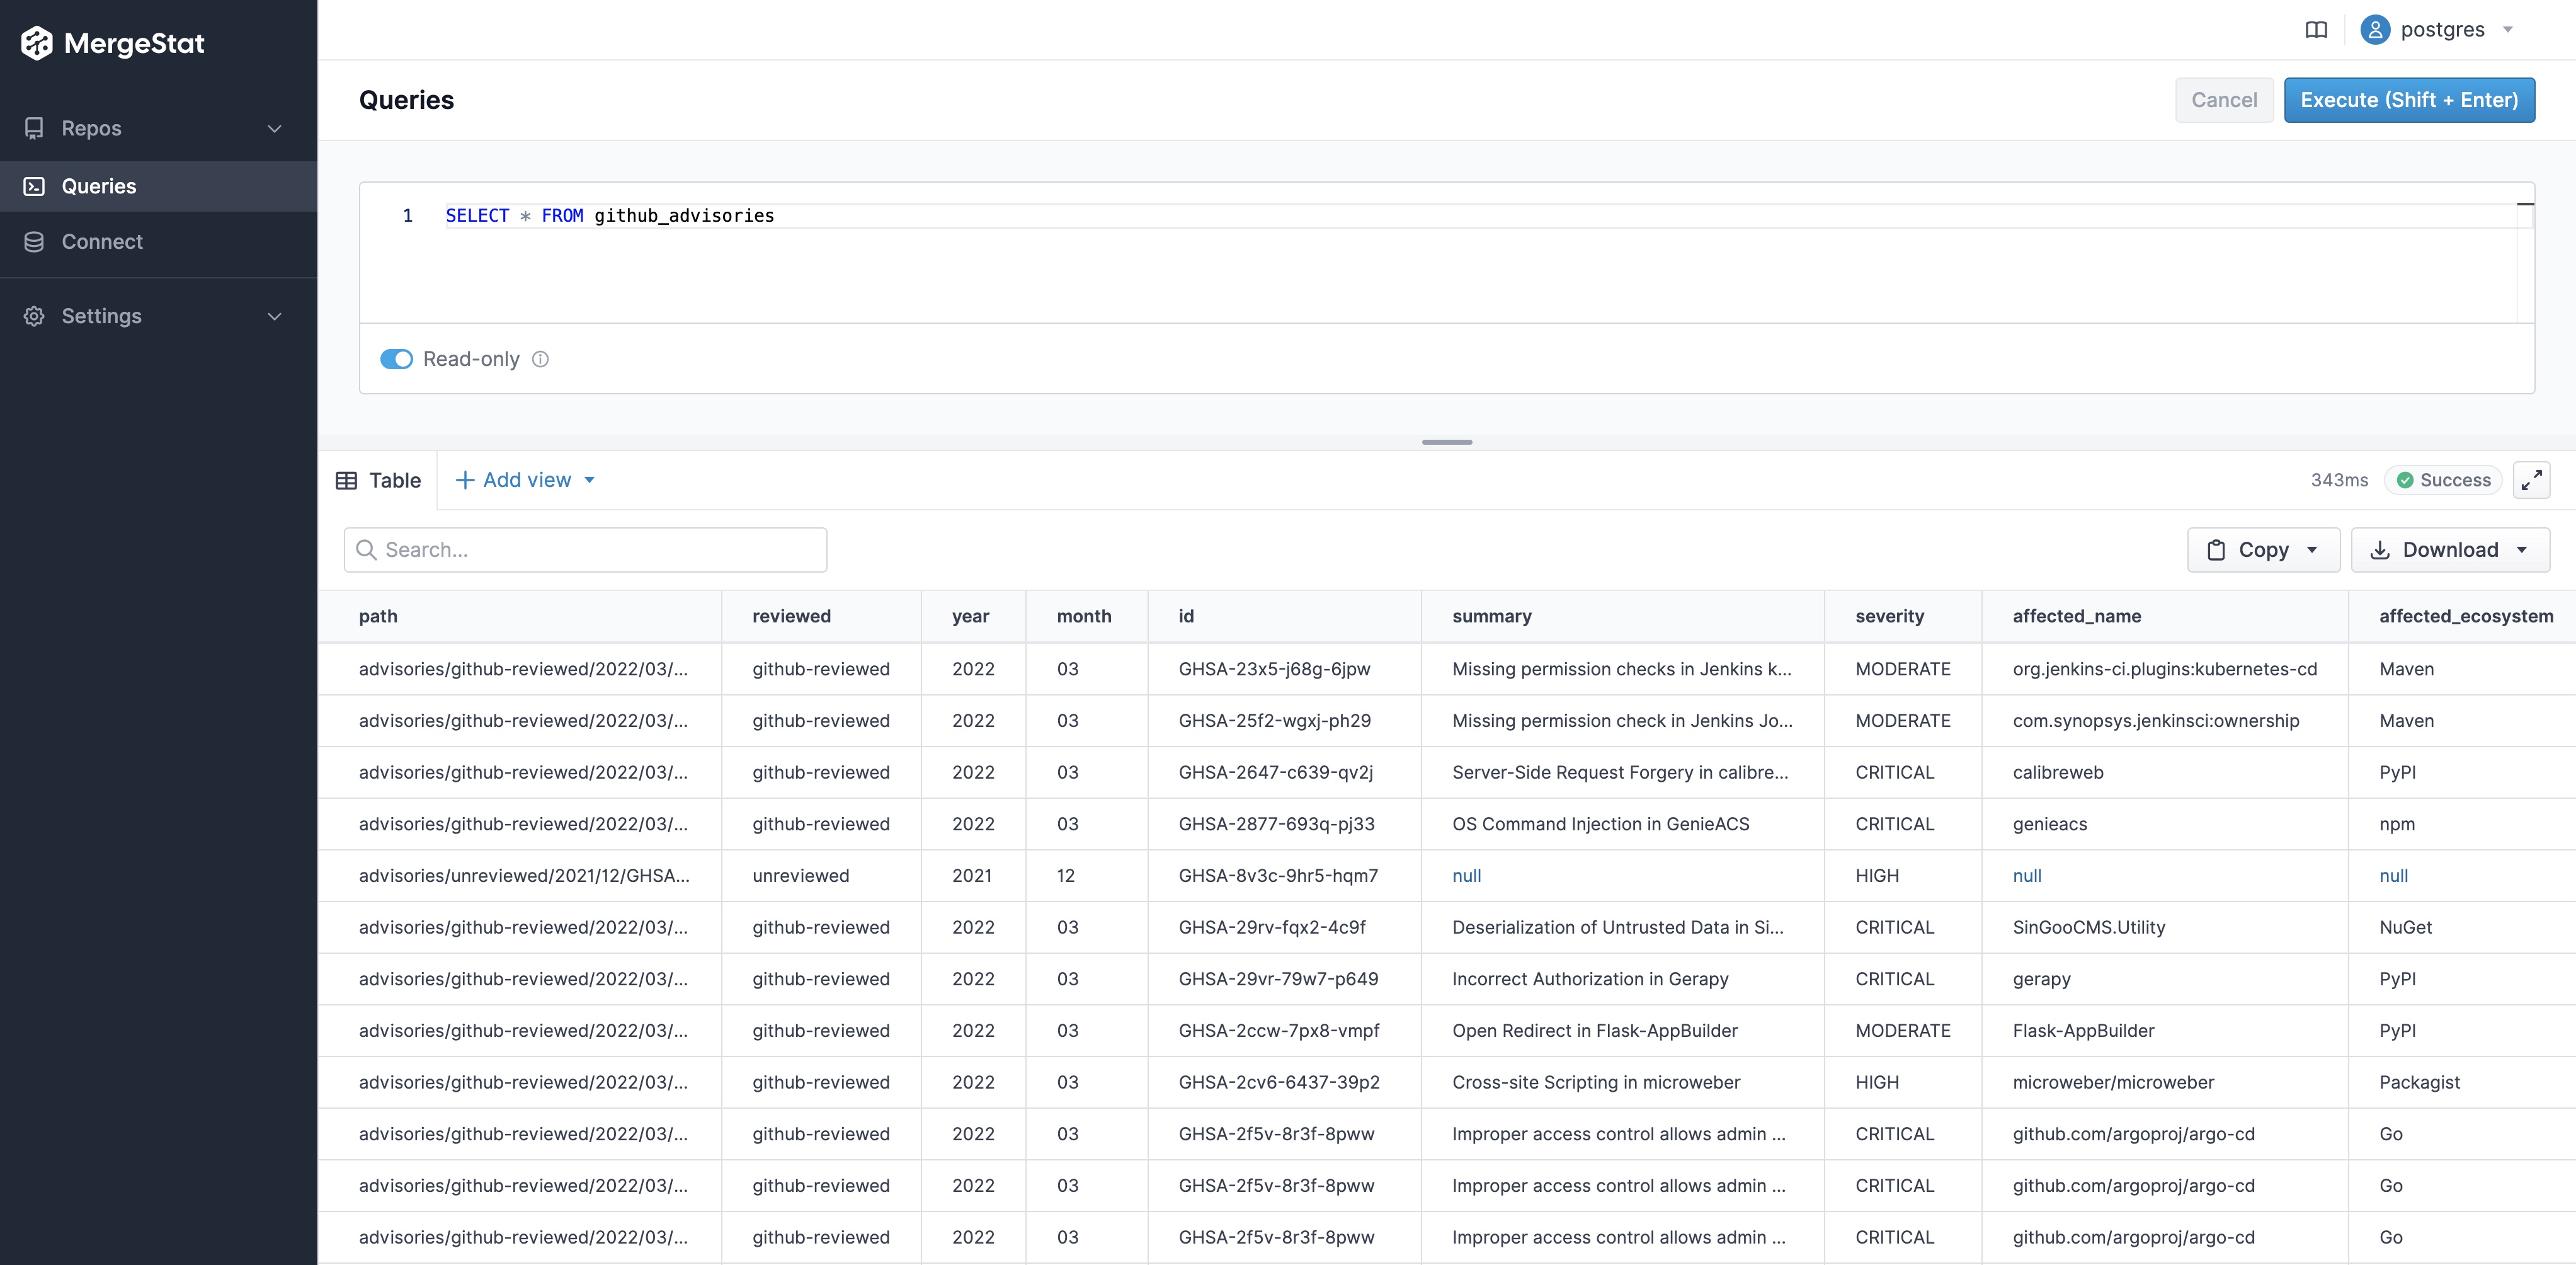
without needing to carry over the parsing and JSON logic in every query we run.
How many advisories are reviewed vs unreviewed?
SELECT
    count(1) as total,
    count(1) FILTER (WHERE reviewed = 'github-reviewed') as reviewed,
    count(1) FILTER (WHERE reviewed = 'unreviewed') as unreviewed
FROM github_advisories
- 201,711 total advisories (at time of writing)
- 19,078 advisories have been reviewed by GitHub (~9% of total)
- 182,633 remain unreviewed
(Clearly the GitHub team has quite a bit on their plate 😀)
How many advisories exist by ecosystem?
Ecosystem here refers to the package registry the advisory was found in.
Looks like PyPi has the most and Pub the least.
Note that we're excluding results where an affected ecosystem is not listed.
SELECT
    affected_ecosystem,
    count(*)
FROM github_advisories
WHERE affected_ecosystem IS NOT NULL -- where the affected ecosystem is known
GROUP BY affected_ecosystem
ORDER BY count(*) DESC

How many advisories exist by ecosystem and severity?
Severity here is one of CRITICAL, HIGH, MODERATE, and LOW.
SELECT
    affected_ecosystem,
    severity,
    count(*)
FROM github_advisories
WHERE affected_ecosystem IS NOT NULL -- where the affected ecosystem is known
GROUP BY affected_ecosystem, severity
ORDER BY count(*) DESC
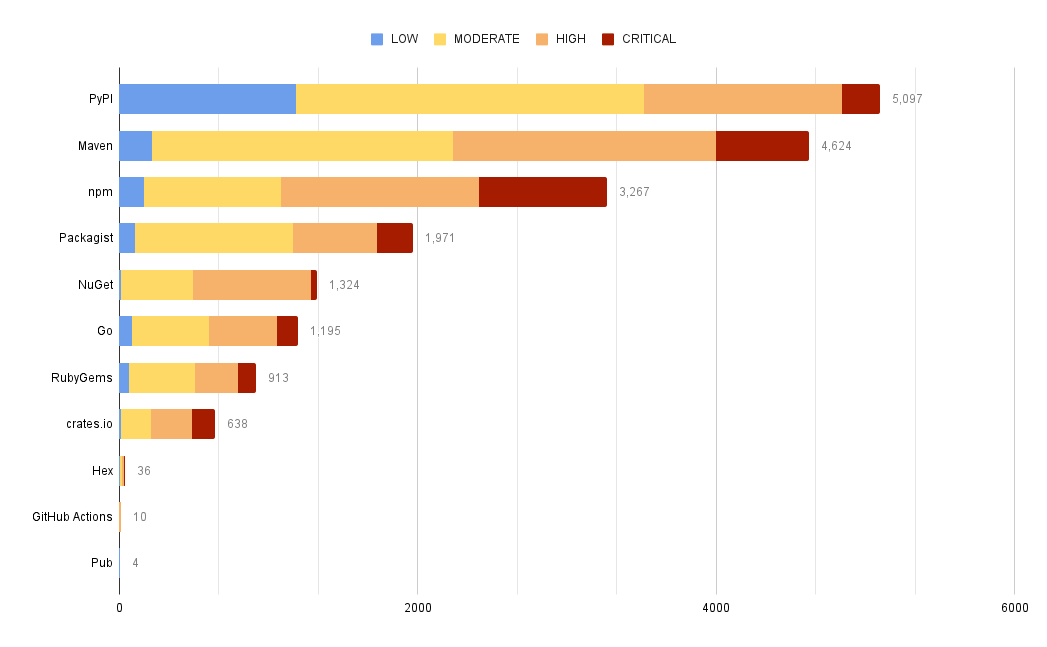
Some ecosystems have fewer advisories overall, but a higher percentage of those advisories are CRITICAL.
How many advisories have been published over time?
SELECT
    extract(year from published) || '-Q' ||extract(quarter from published) as quarter,
    count(*)
FROM github_advisories
GROUP by extract(year from published), extract(quarter from published)
ORDER BY extract(year from published) ASC, extract(quarter from published) ASC
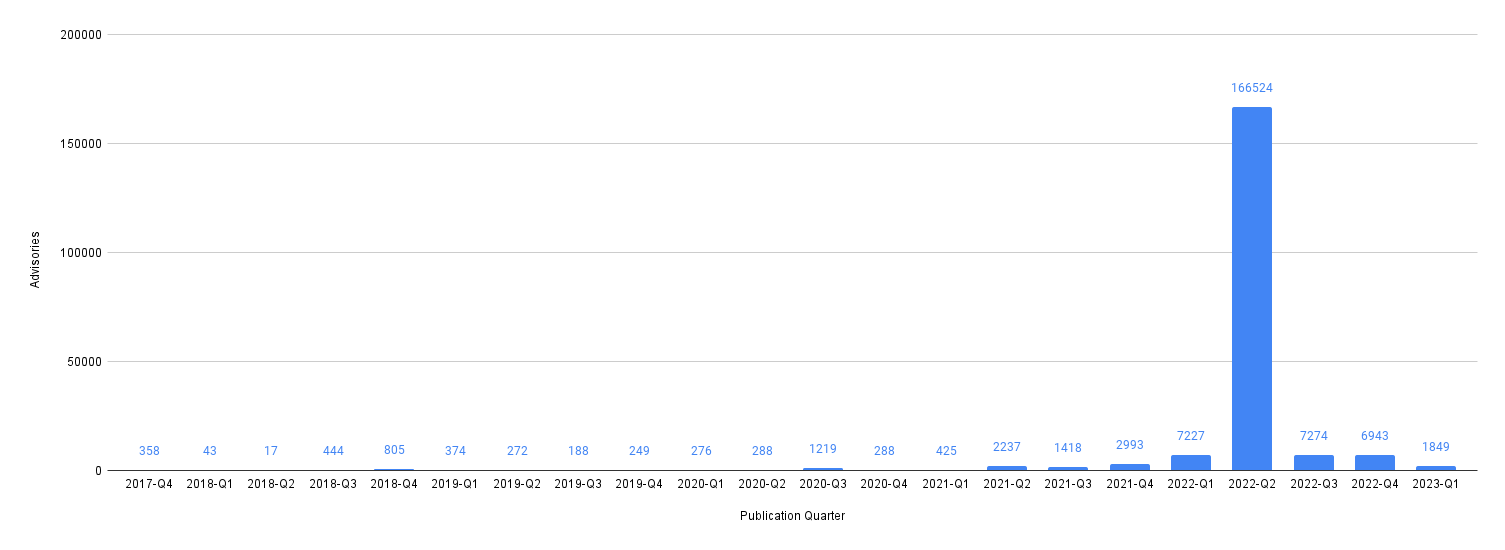
Looks like a ton of advisories were published in Q2 2022, making it hard to see overall trends.
What's been the makeup of advisory severity over time?
SELECT
    extract(year from published) || '-Q' ||extract(quarter from published) as quarter,
    severity,
    count(*)
FROM github_advisories
GROUP by extract(year from published), extract(quarter from published), severity
ORDER BY extract(year from published) ASC, extract(quarter from published) ASC

 With 100% stacking
What's been the makeup of advisory ecosystem over time?
SELECT
    extract(year from published) || '-Q' ||extract(quarter from published) as quarter,
    affected_ecosystem,
    count(*)
FROM github_advisories
GROUP by extract(year from published), extract(quarter from published), affected_ecosystem
ORDER BY extract(year from published) ASC, extract(quarter from published) ASC

(Where the ecosystem is known).
What packages have the most advisories?
SELECT affected_name, affected_ecosystem, count(*)
FROM github_advisories
WHERE affected_ecosystem IS NOT NULL
GROUP BY affected_name, affected_ecosystem
ORDER BY count(*) DESC
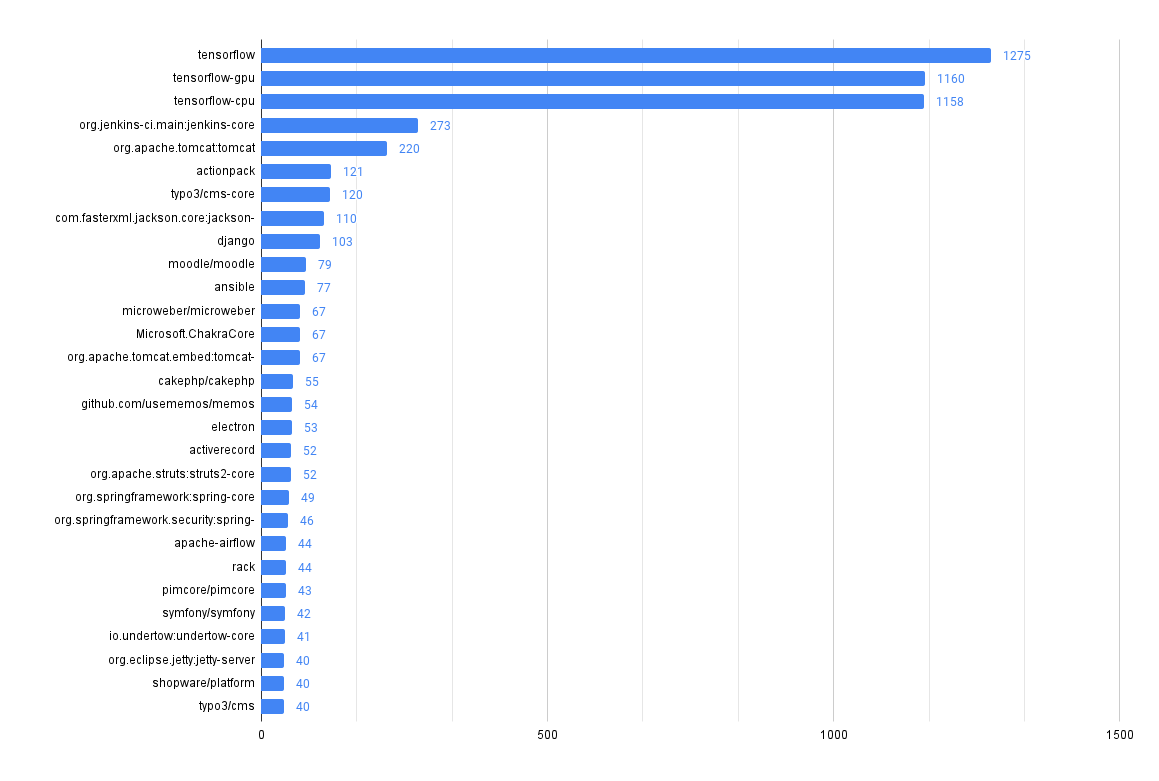
Looks like there's a lot going on in tensorflow!
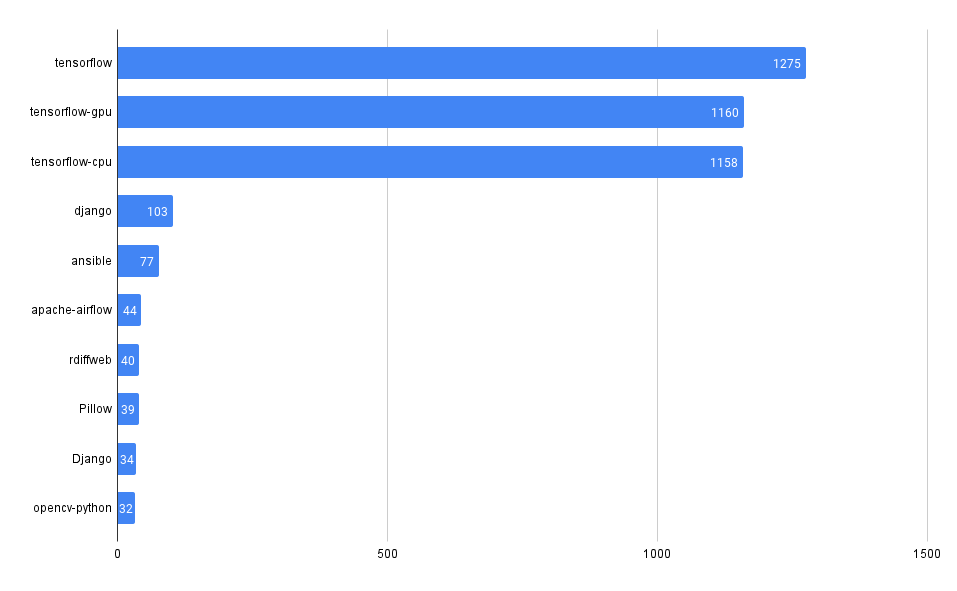
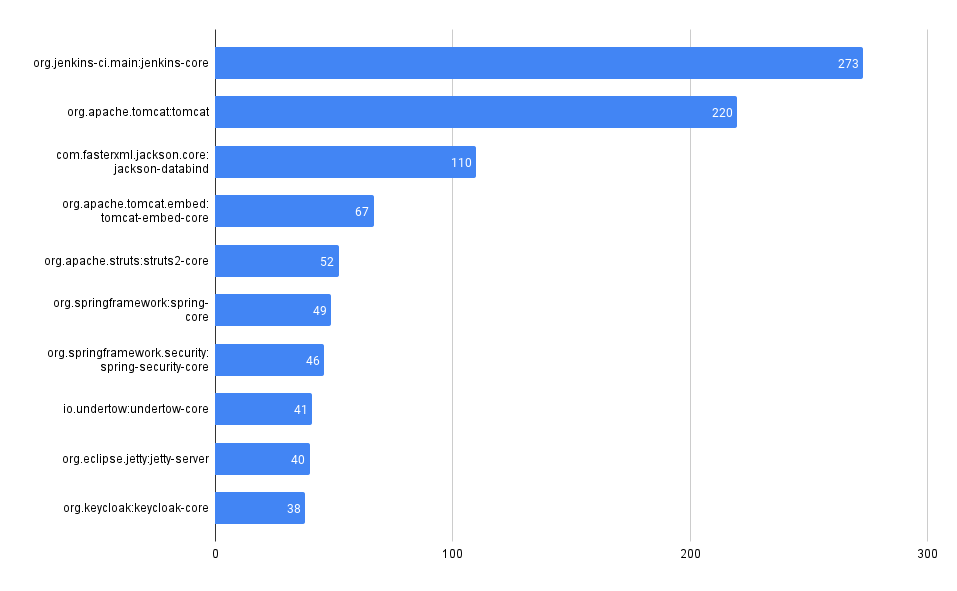
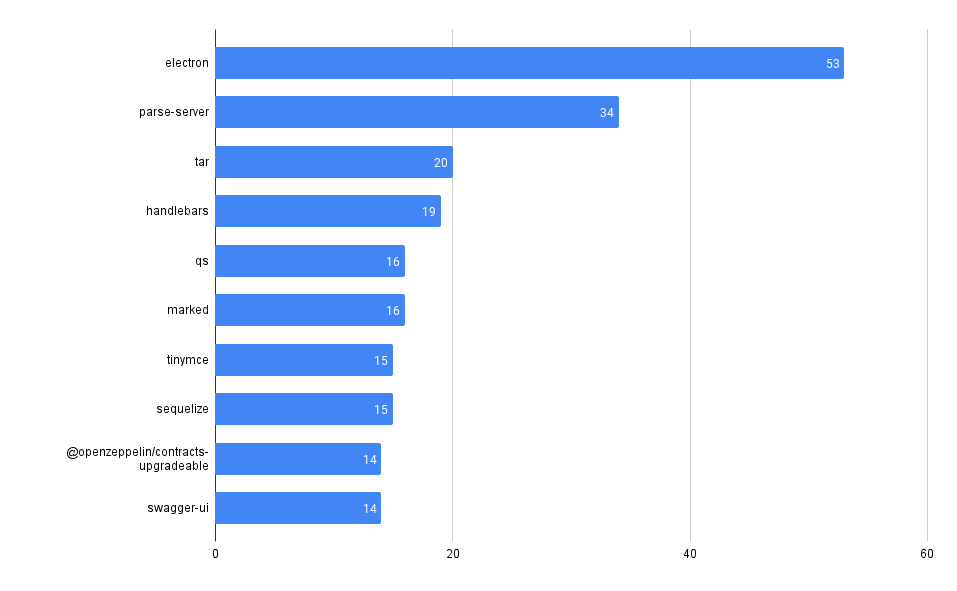
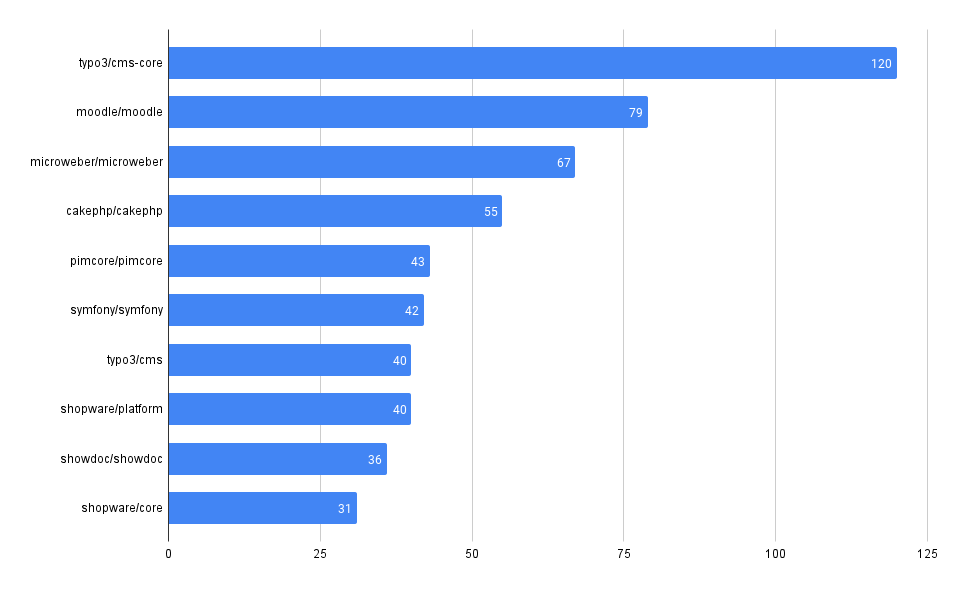
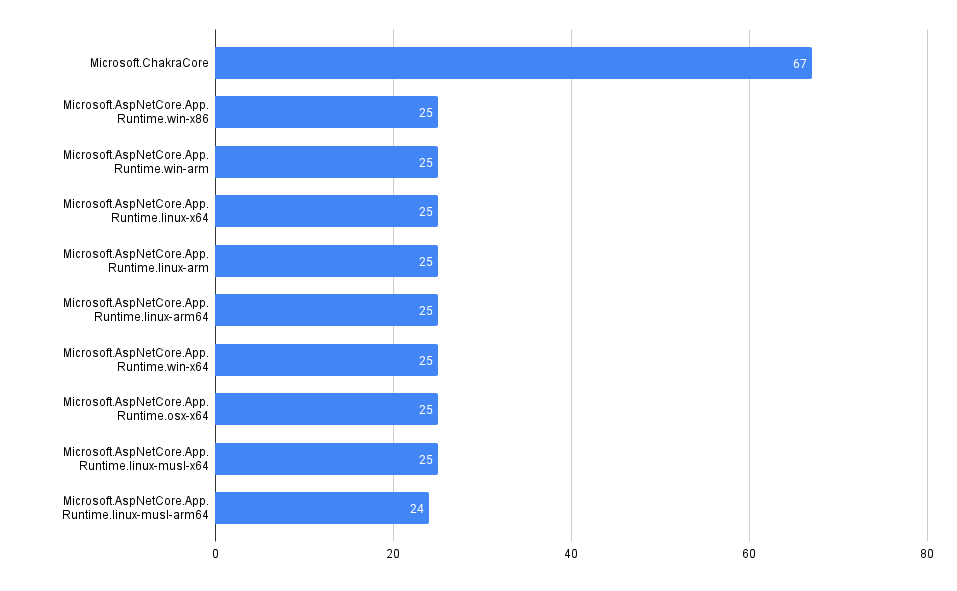
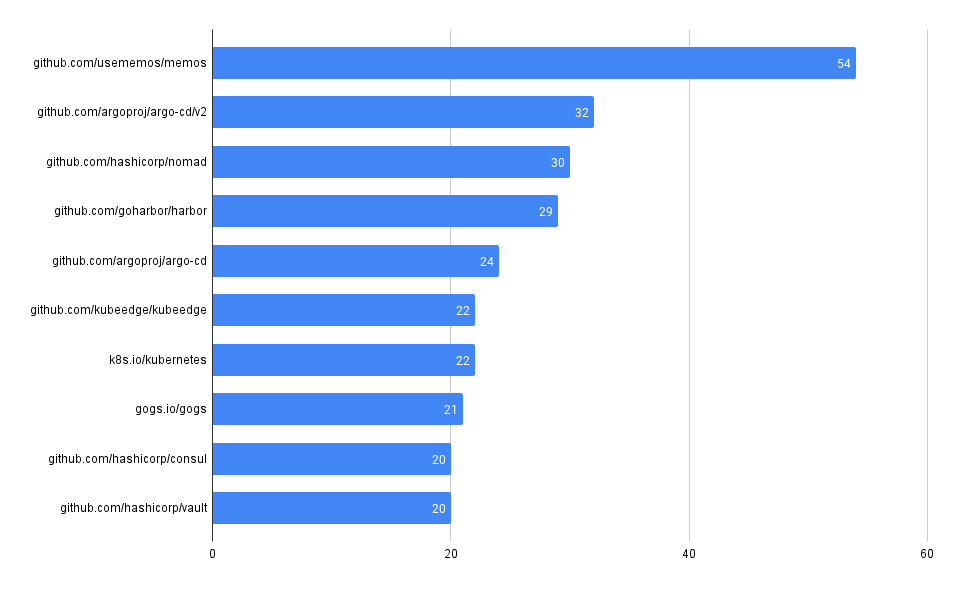
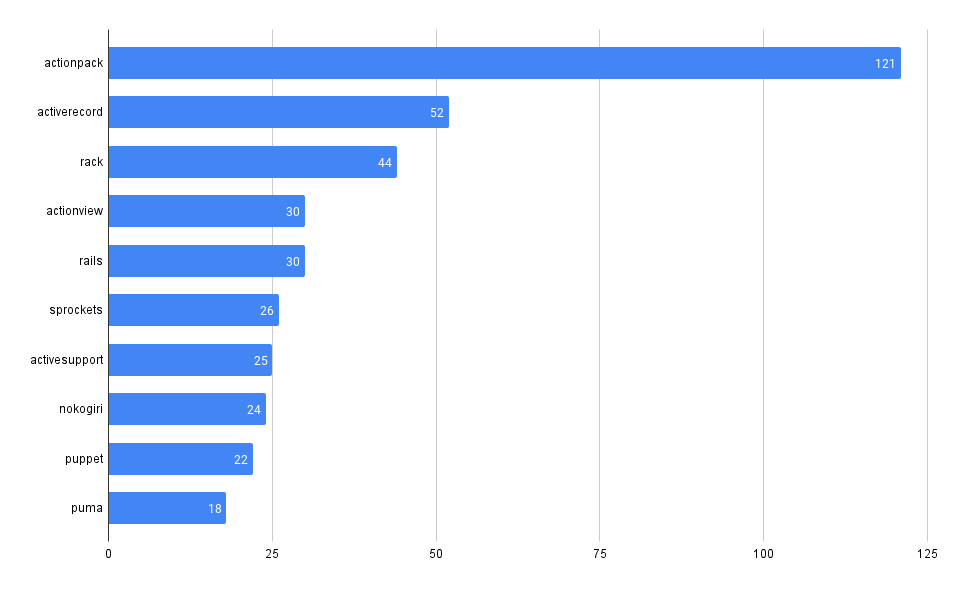
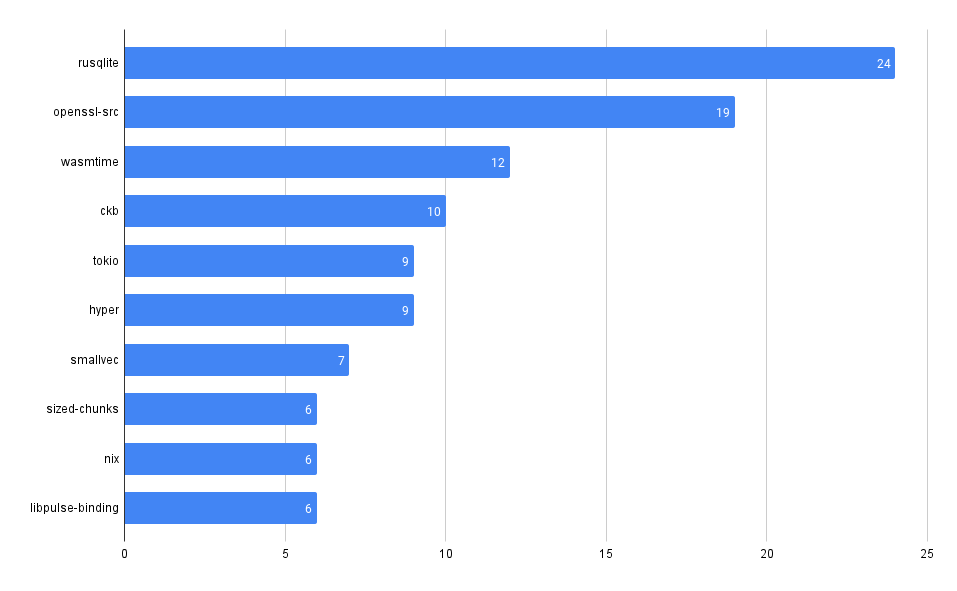
What packages have the most advisories, by ecosystem?
SELECT affected_name, affected_ecosystem, count(*)
FROM github_advisories
WHERE affected_ecosystem IS NOT NULL AND affected_ecosystem = 'REPLACE_WITH_ECOSYSTEM'
GROUP BY affected_name, affected_ecosystem
ORDER BY count(*) DESC
LIMIT 10
PyPI
Maven
npm
Packagist
NuGet
Go
RubyGems
crates.io
Next Steps
This has been a high level view of all the advisories found in a specific GitHub-maintained public database. To examine the advisories that impact your organization or team, you'd want to join the data in this repository with information about what packages your code brings in - potentially by using SBOMs or even parsing package manifests.
Tools such as Dependabot already do this for the GitHub ecosystem, and automate the maintenance of dependencies as well. There are, however, other databases and ecosystems emerging that track advisories and vulnerabilities. MergeStat supports some of these tools today, and we are working to make it possible for anyone to easily bring the output of their own selection of tools in. We believe the easier it is to access data involved in key aspects of the software-supply-chain, the more secure and the more effective engineering organizations may be.
Our community Slack is a great place to find help and ask questions. We're always happy to chat about MergeStat there 🎉!