
20 posts tagged with "sql"

View All Tags

Patrick DeVivo

MergeStat’s mission is to make it possible to query anything that’s involved in building and shipping software with SQL. One aspect of building and shipping software is the management of open-source security vulnerabilities in the “supply chain” of dependencies your code uses.

In this post, we’ll explore how MergeStat’s integration with code scanners Grype and Trivy allows us to put together an open-source solution for managing vulnerabilities across many Git repositories.
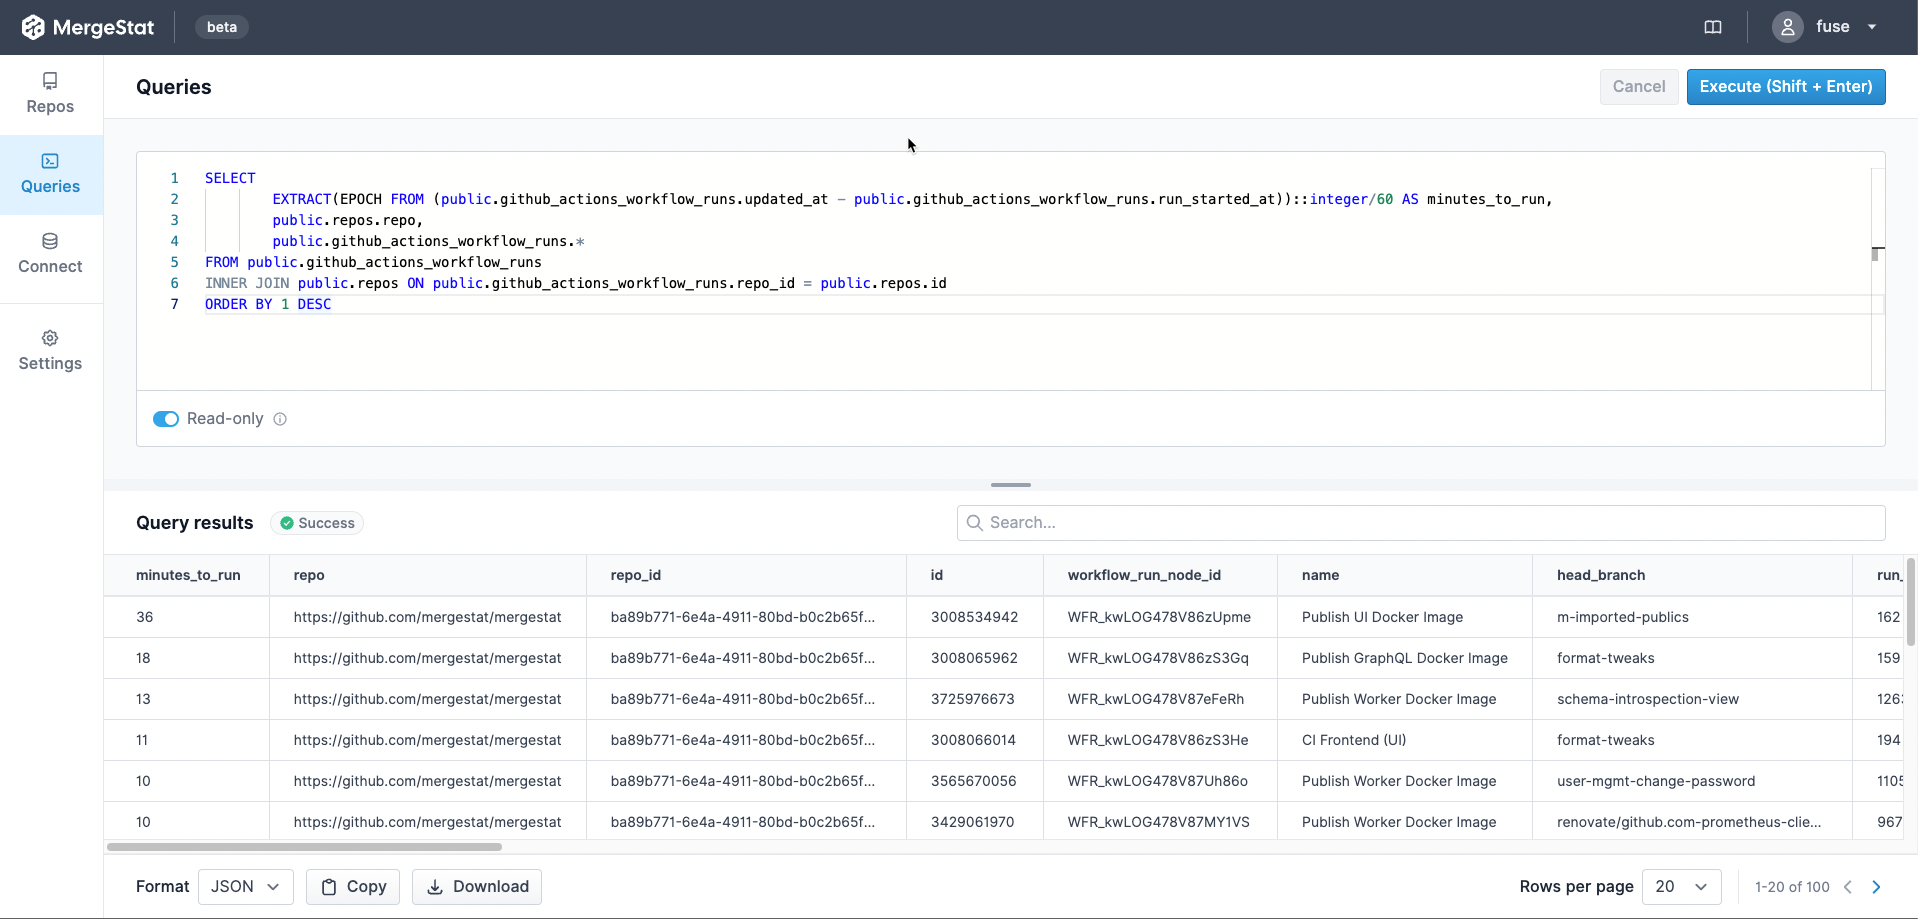
Setup

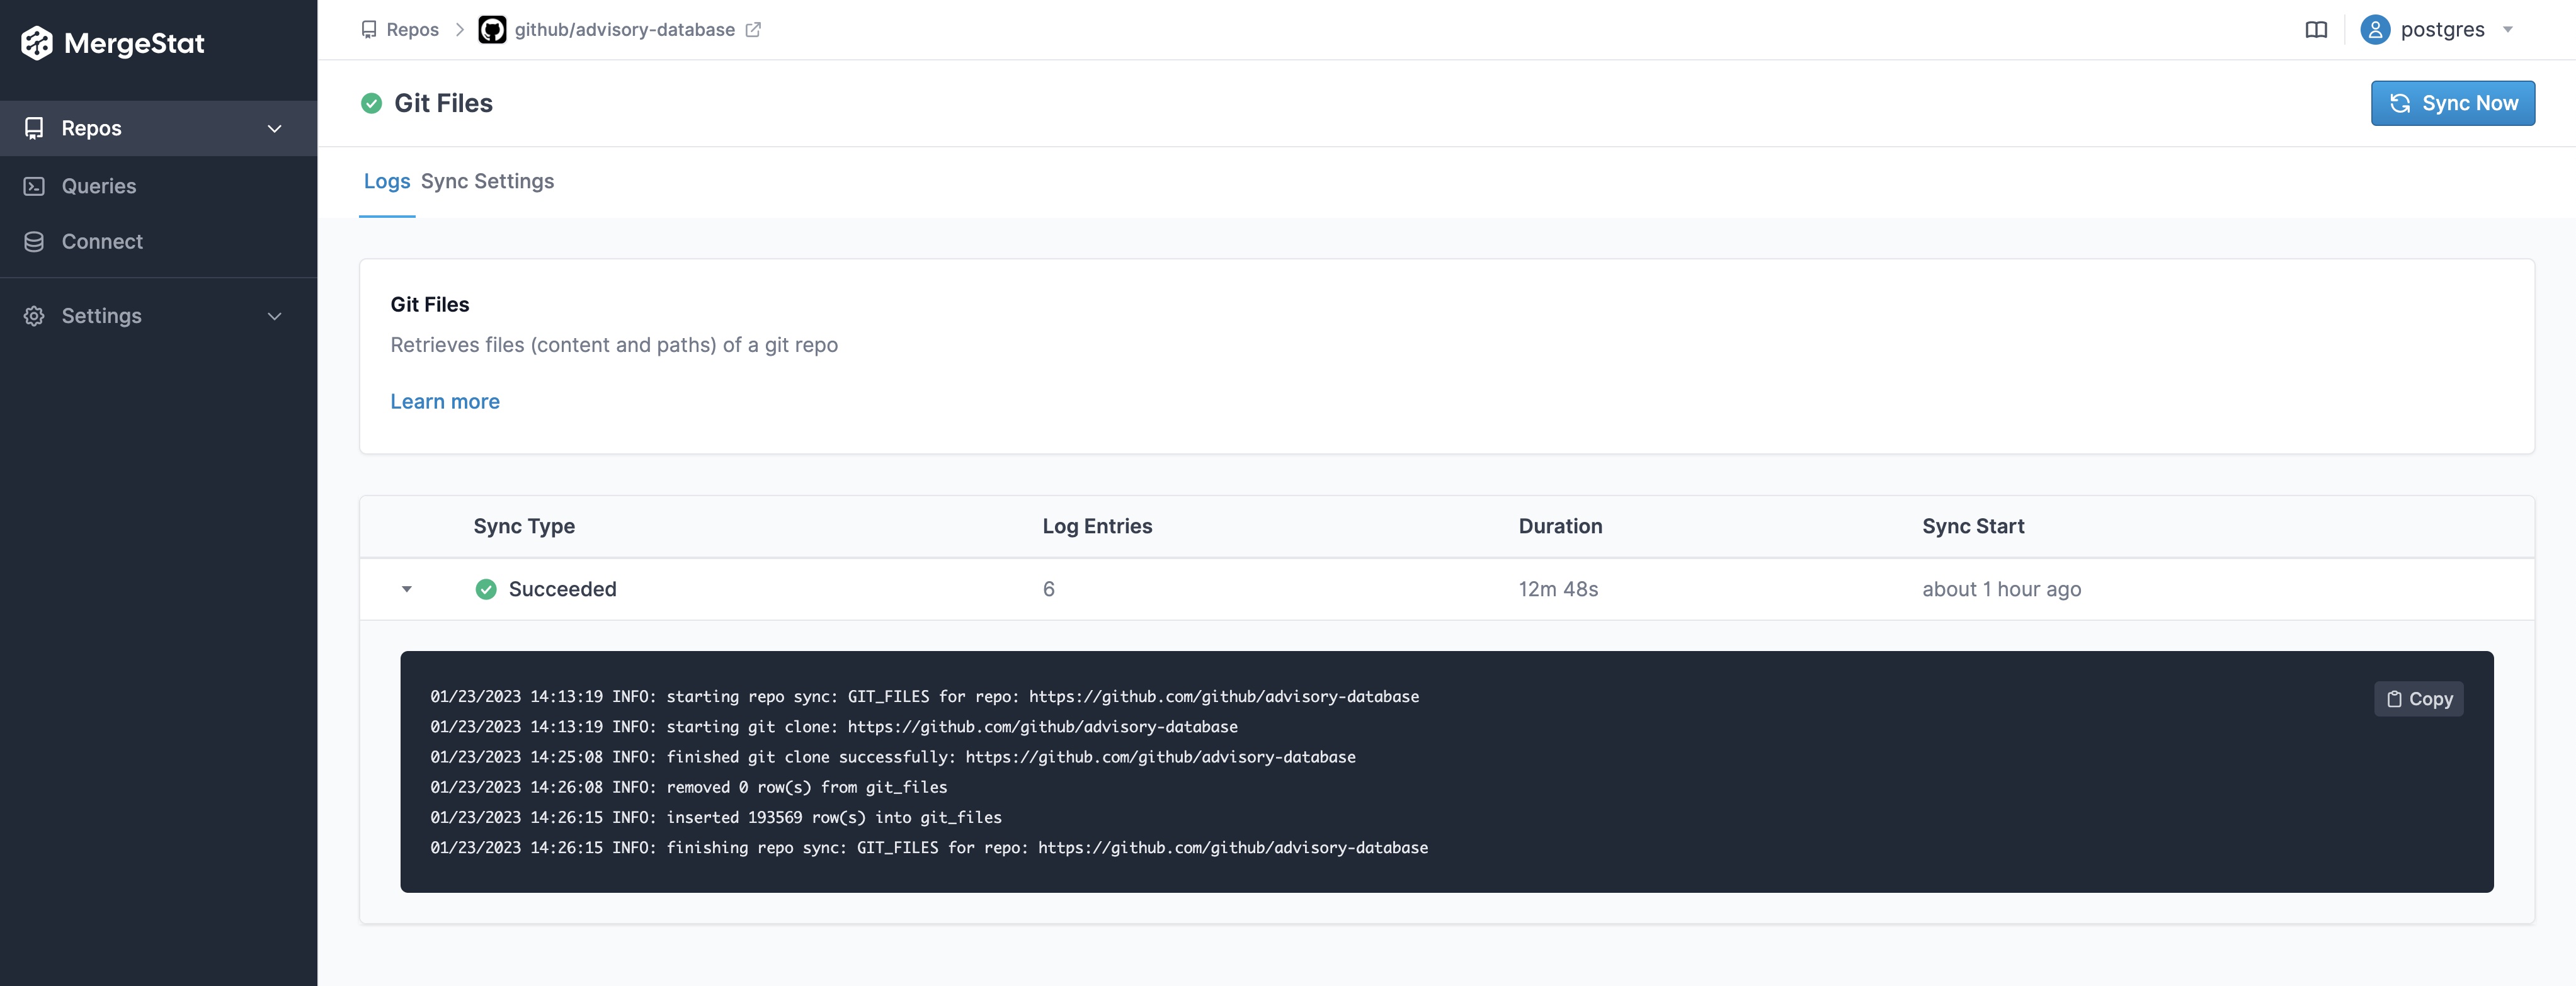
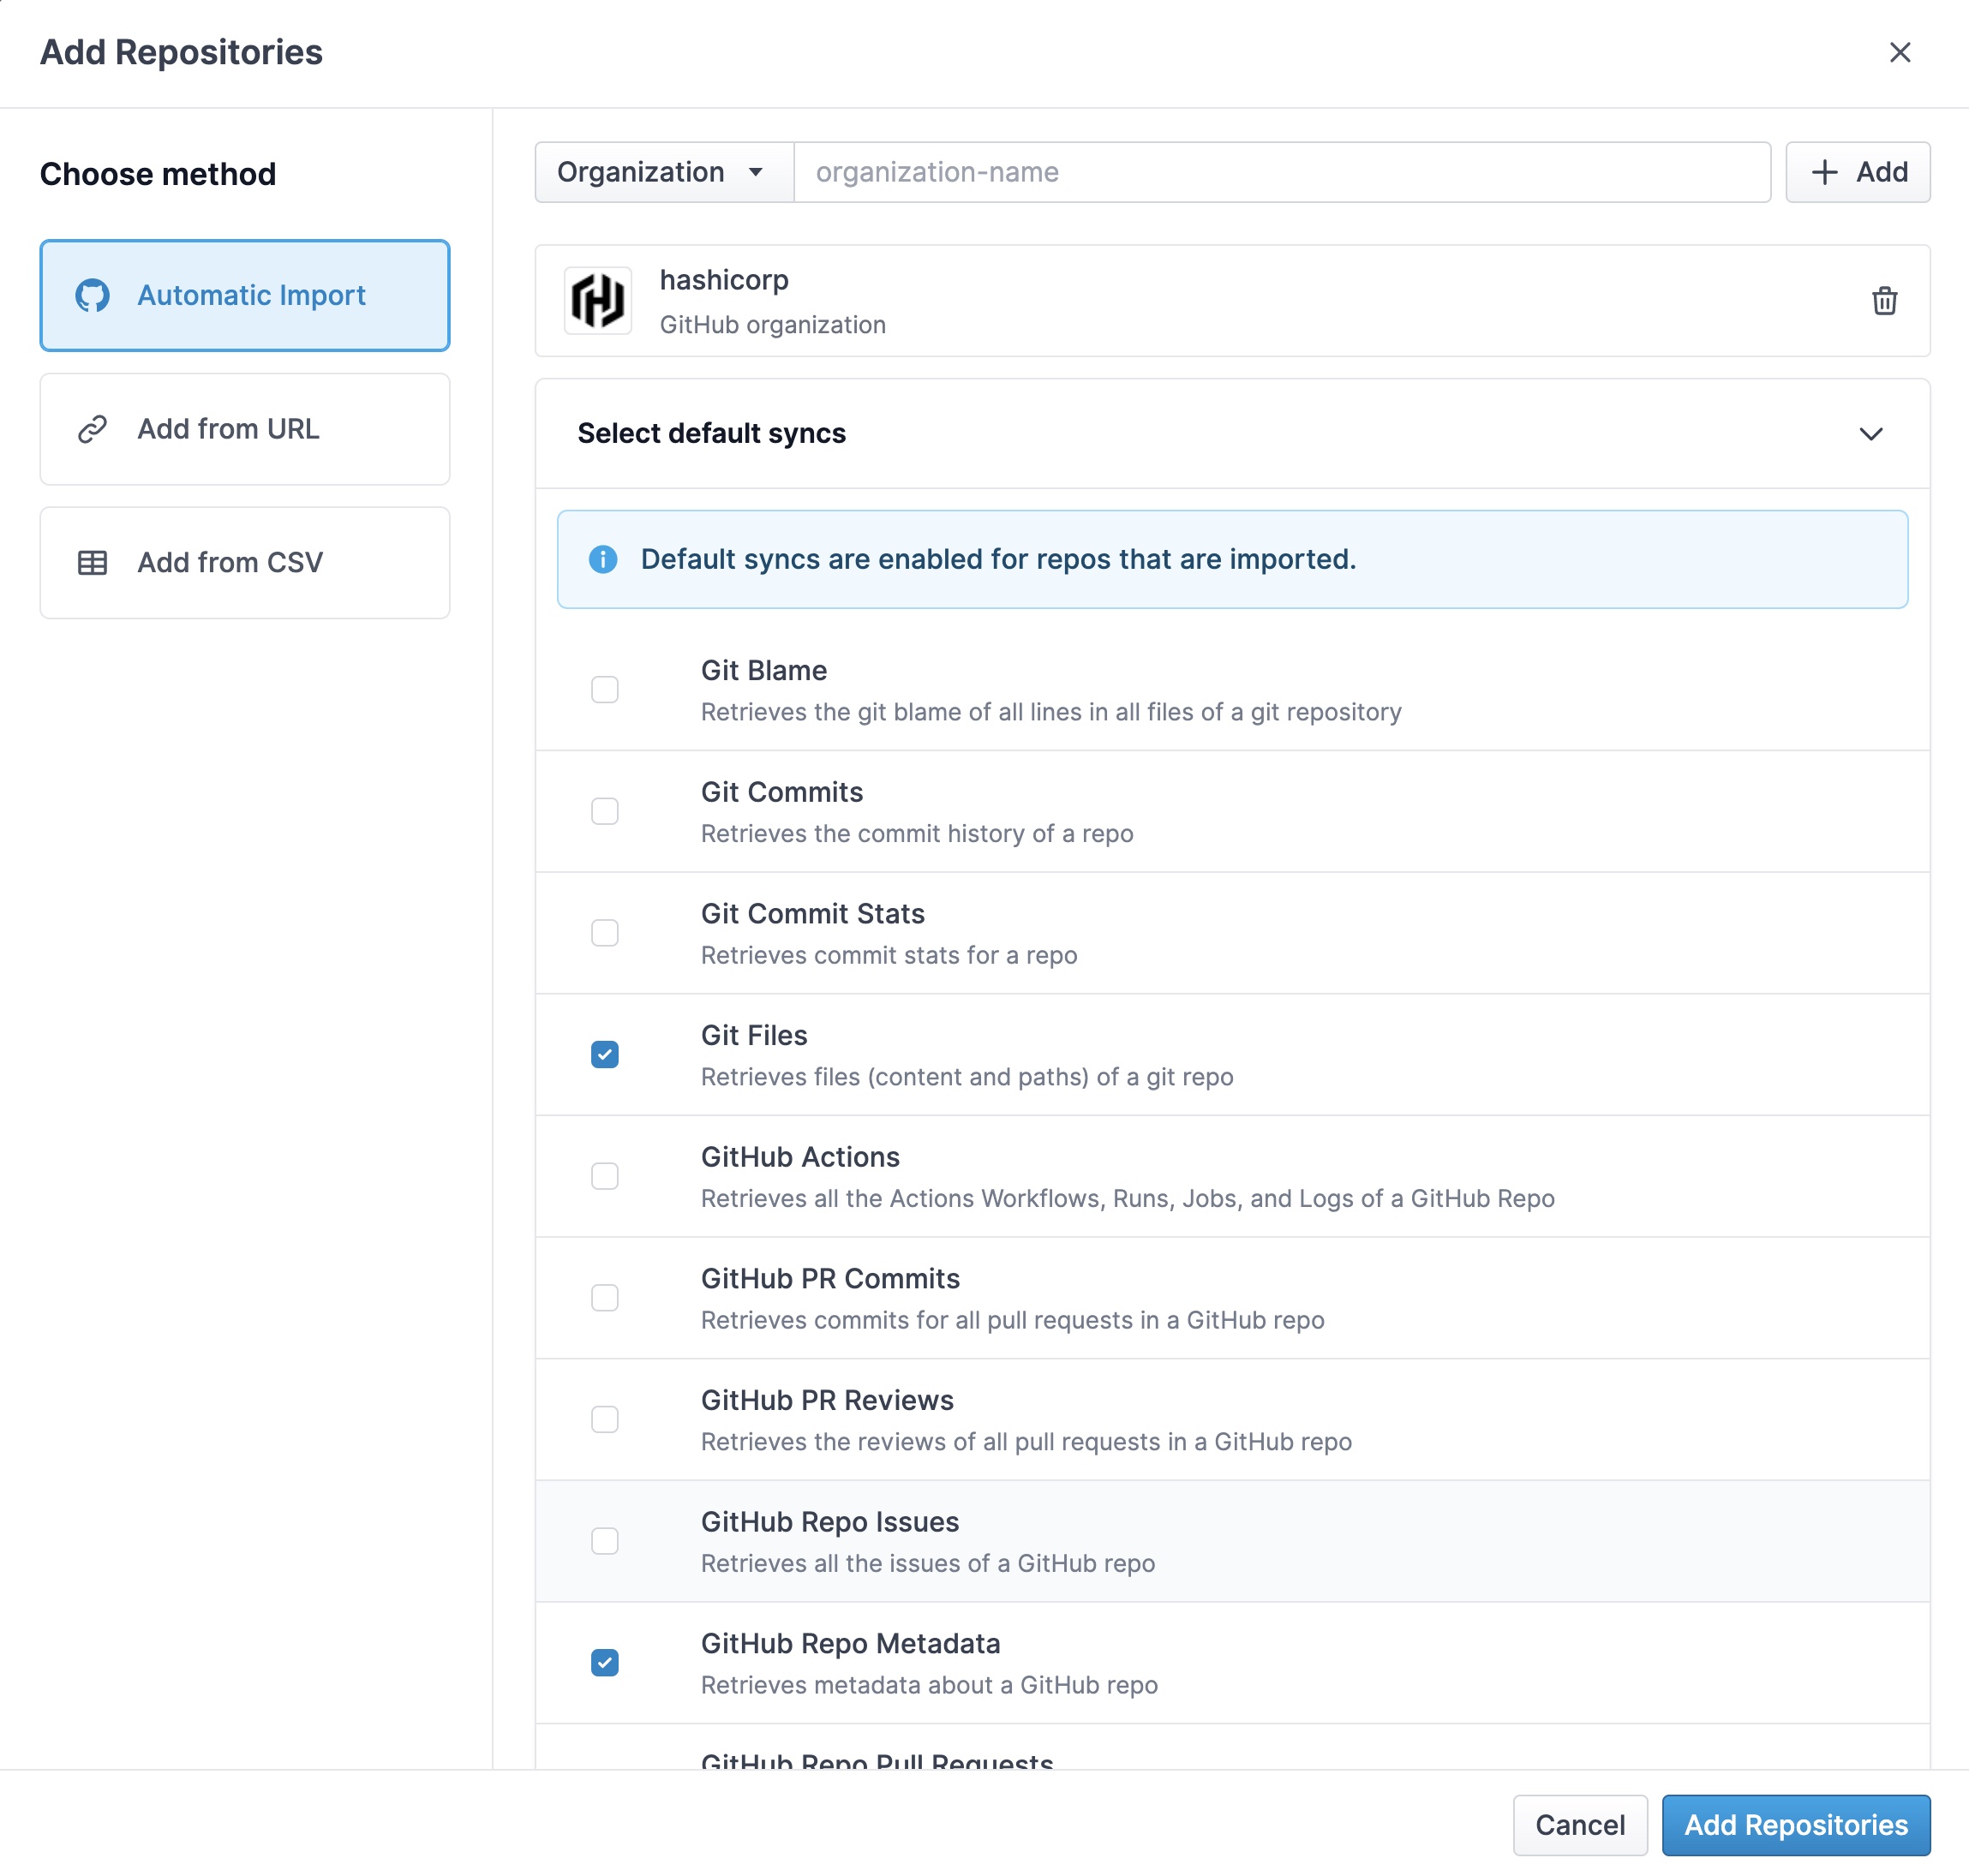
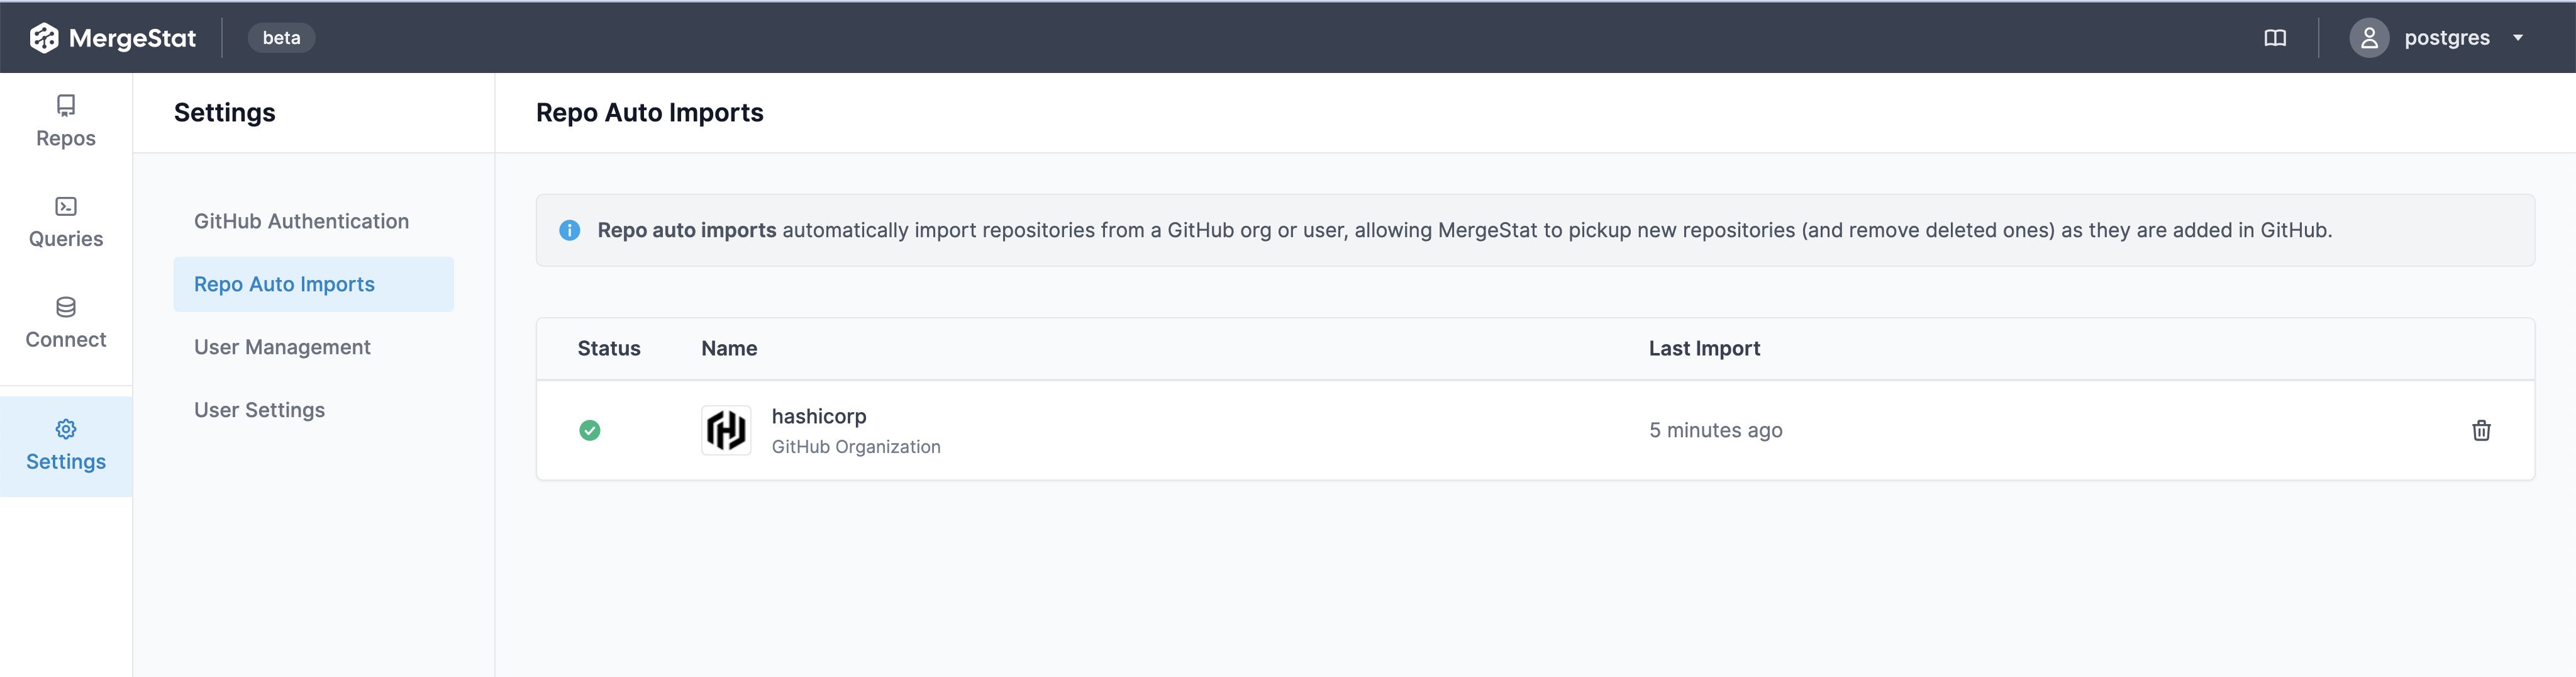
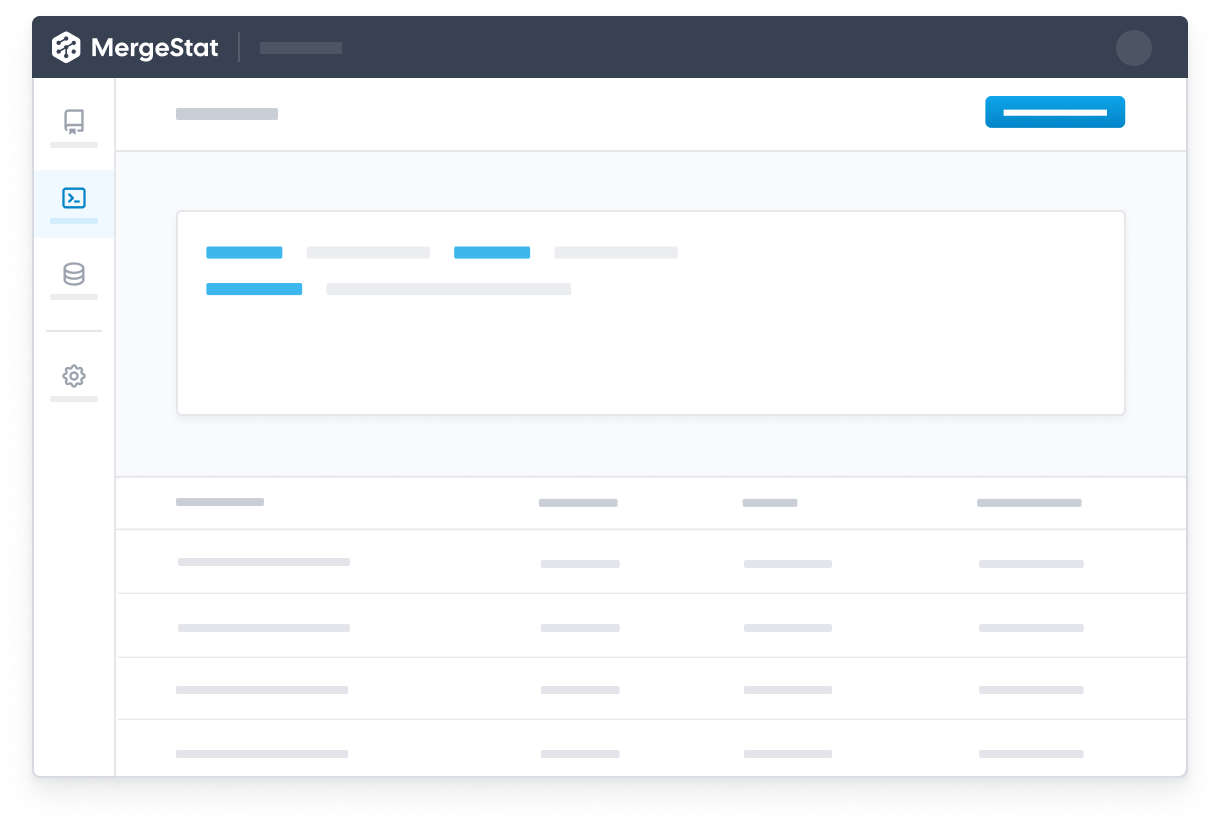
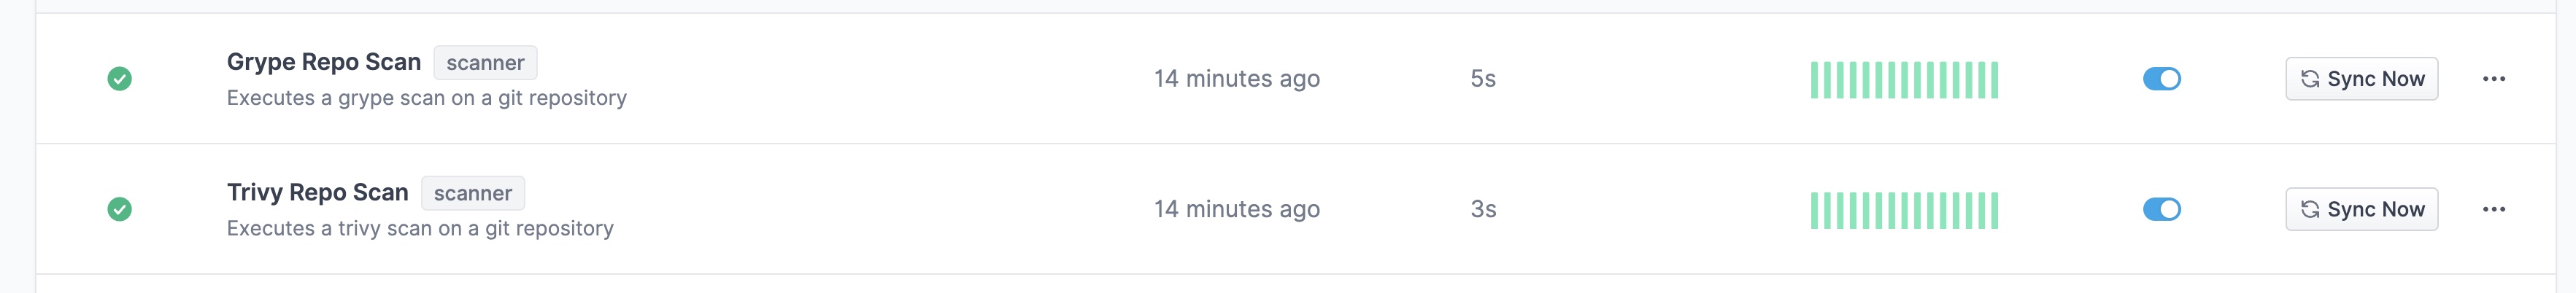
To get started, you'll want an instance of MergeStat (check out how to get started locally). Once you've added your Git repos, turn on the Grype and Trivy scanner syncs:

Screenshot showing the Grype and Trivy scanner configs

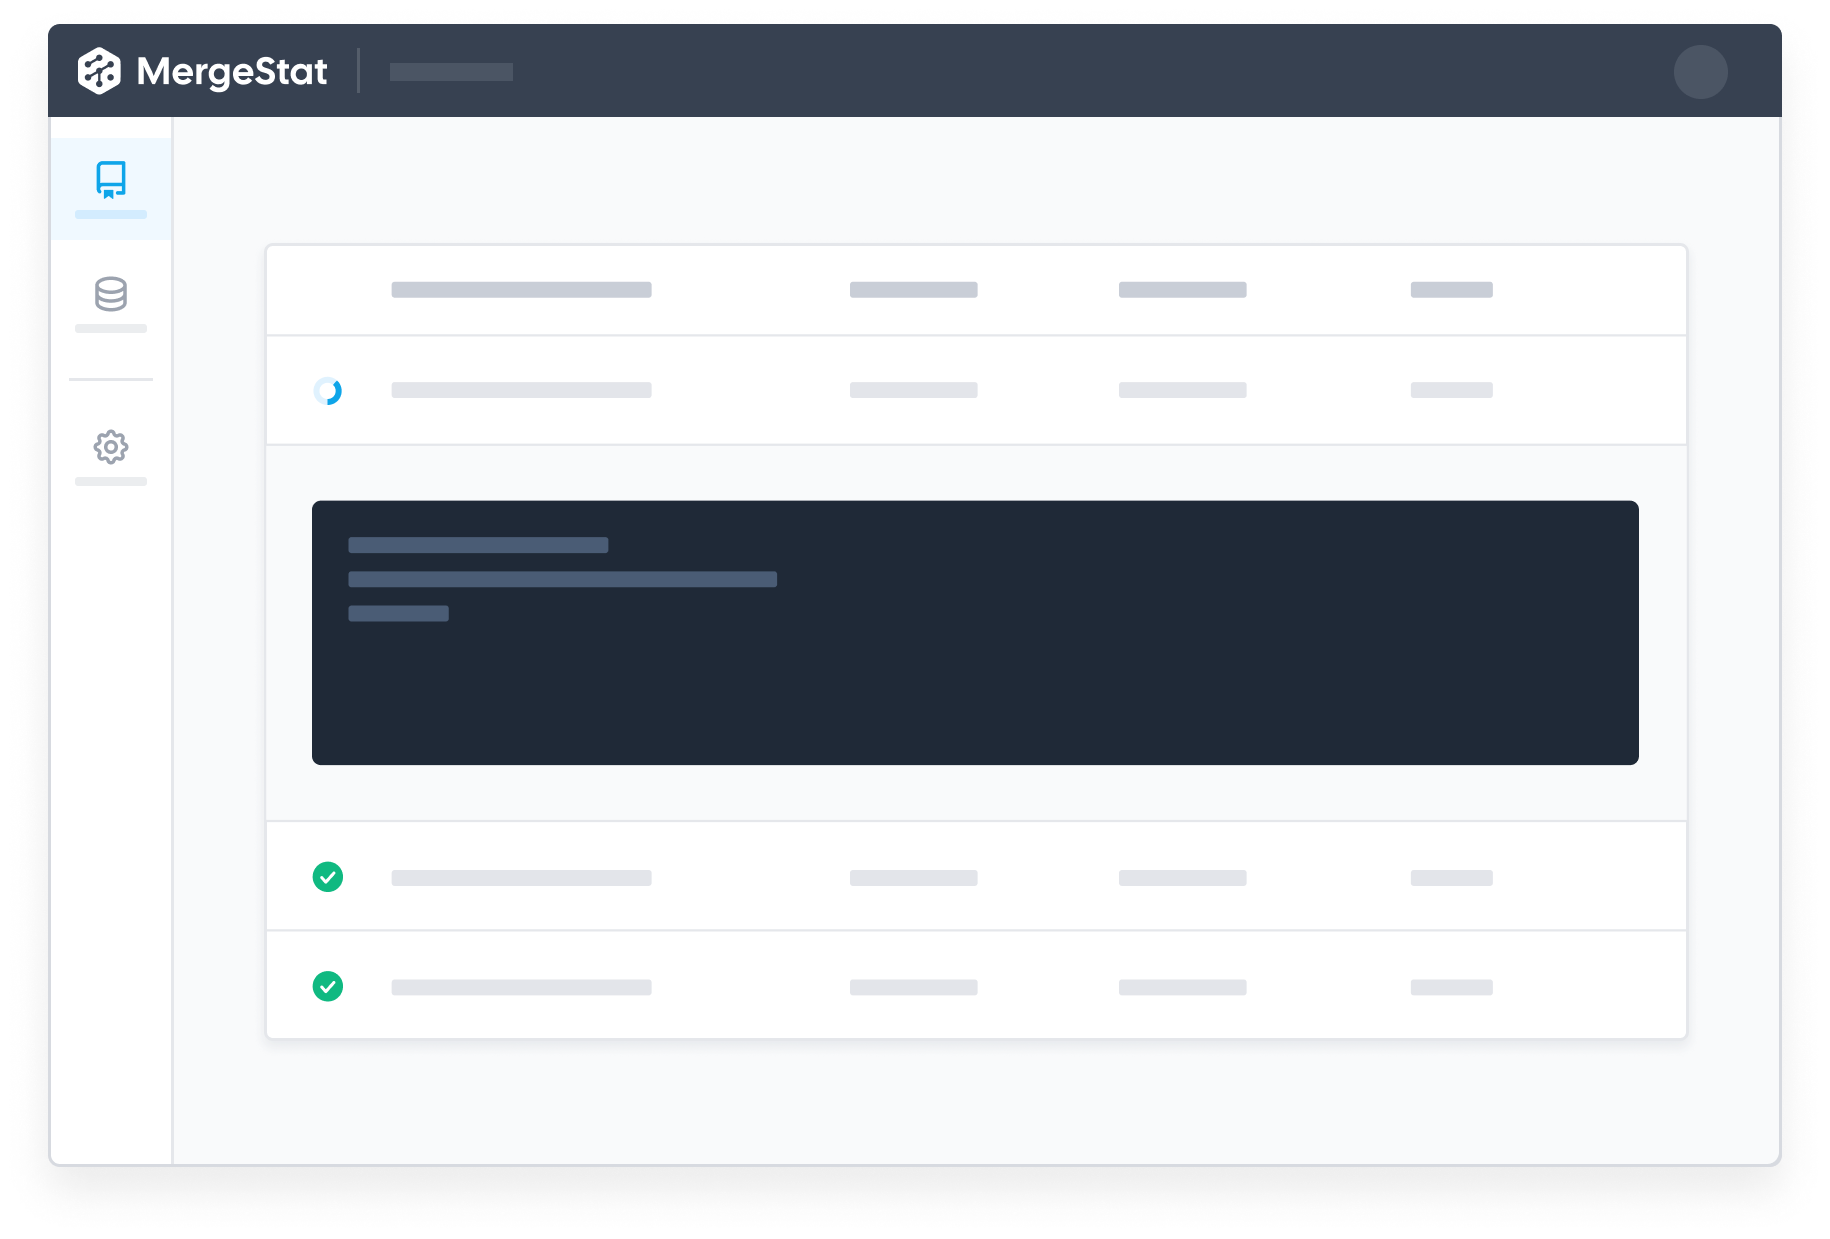
Runs of these syncs should begin populating the following views:

  • grype_repo_vulnerabilities
  • trivy_repo_vulnerabilities

Where each row is a vulnerability detected in a repo by one of the tools.

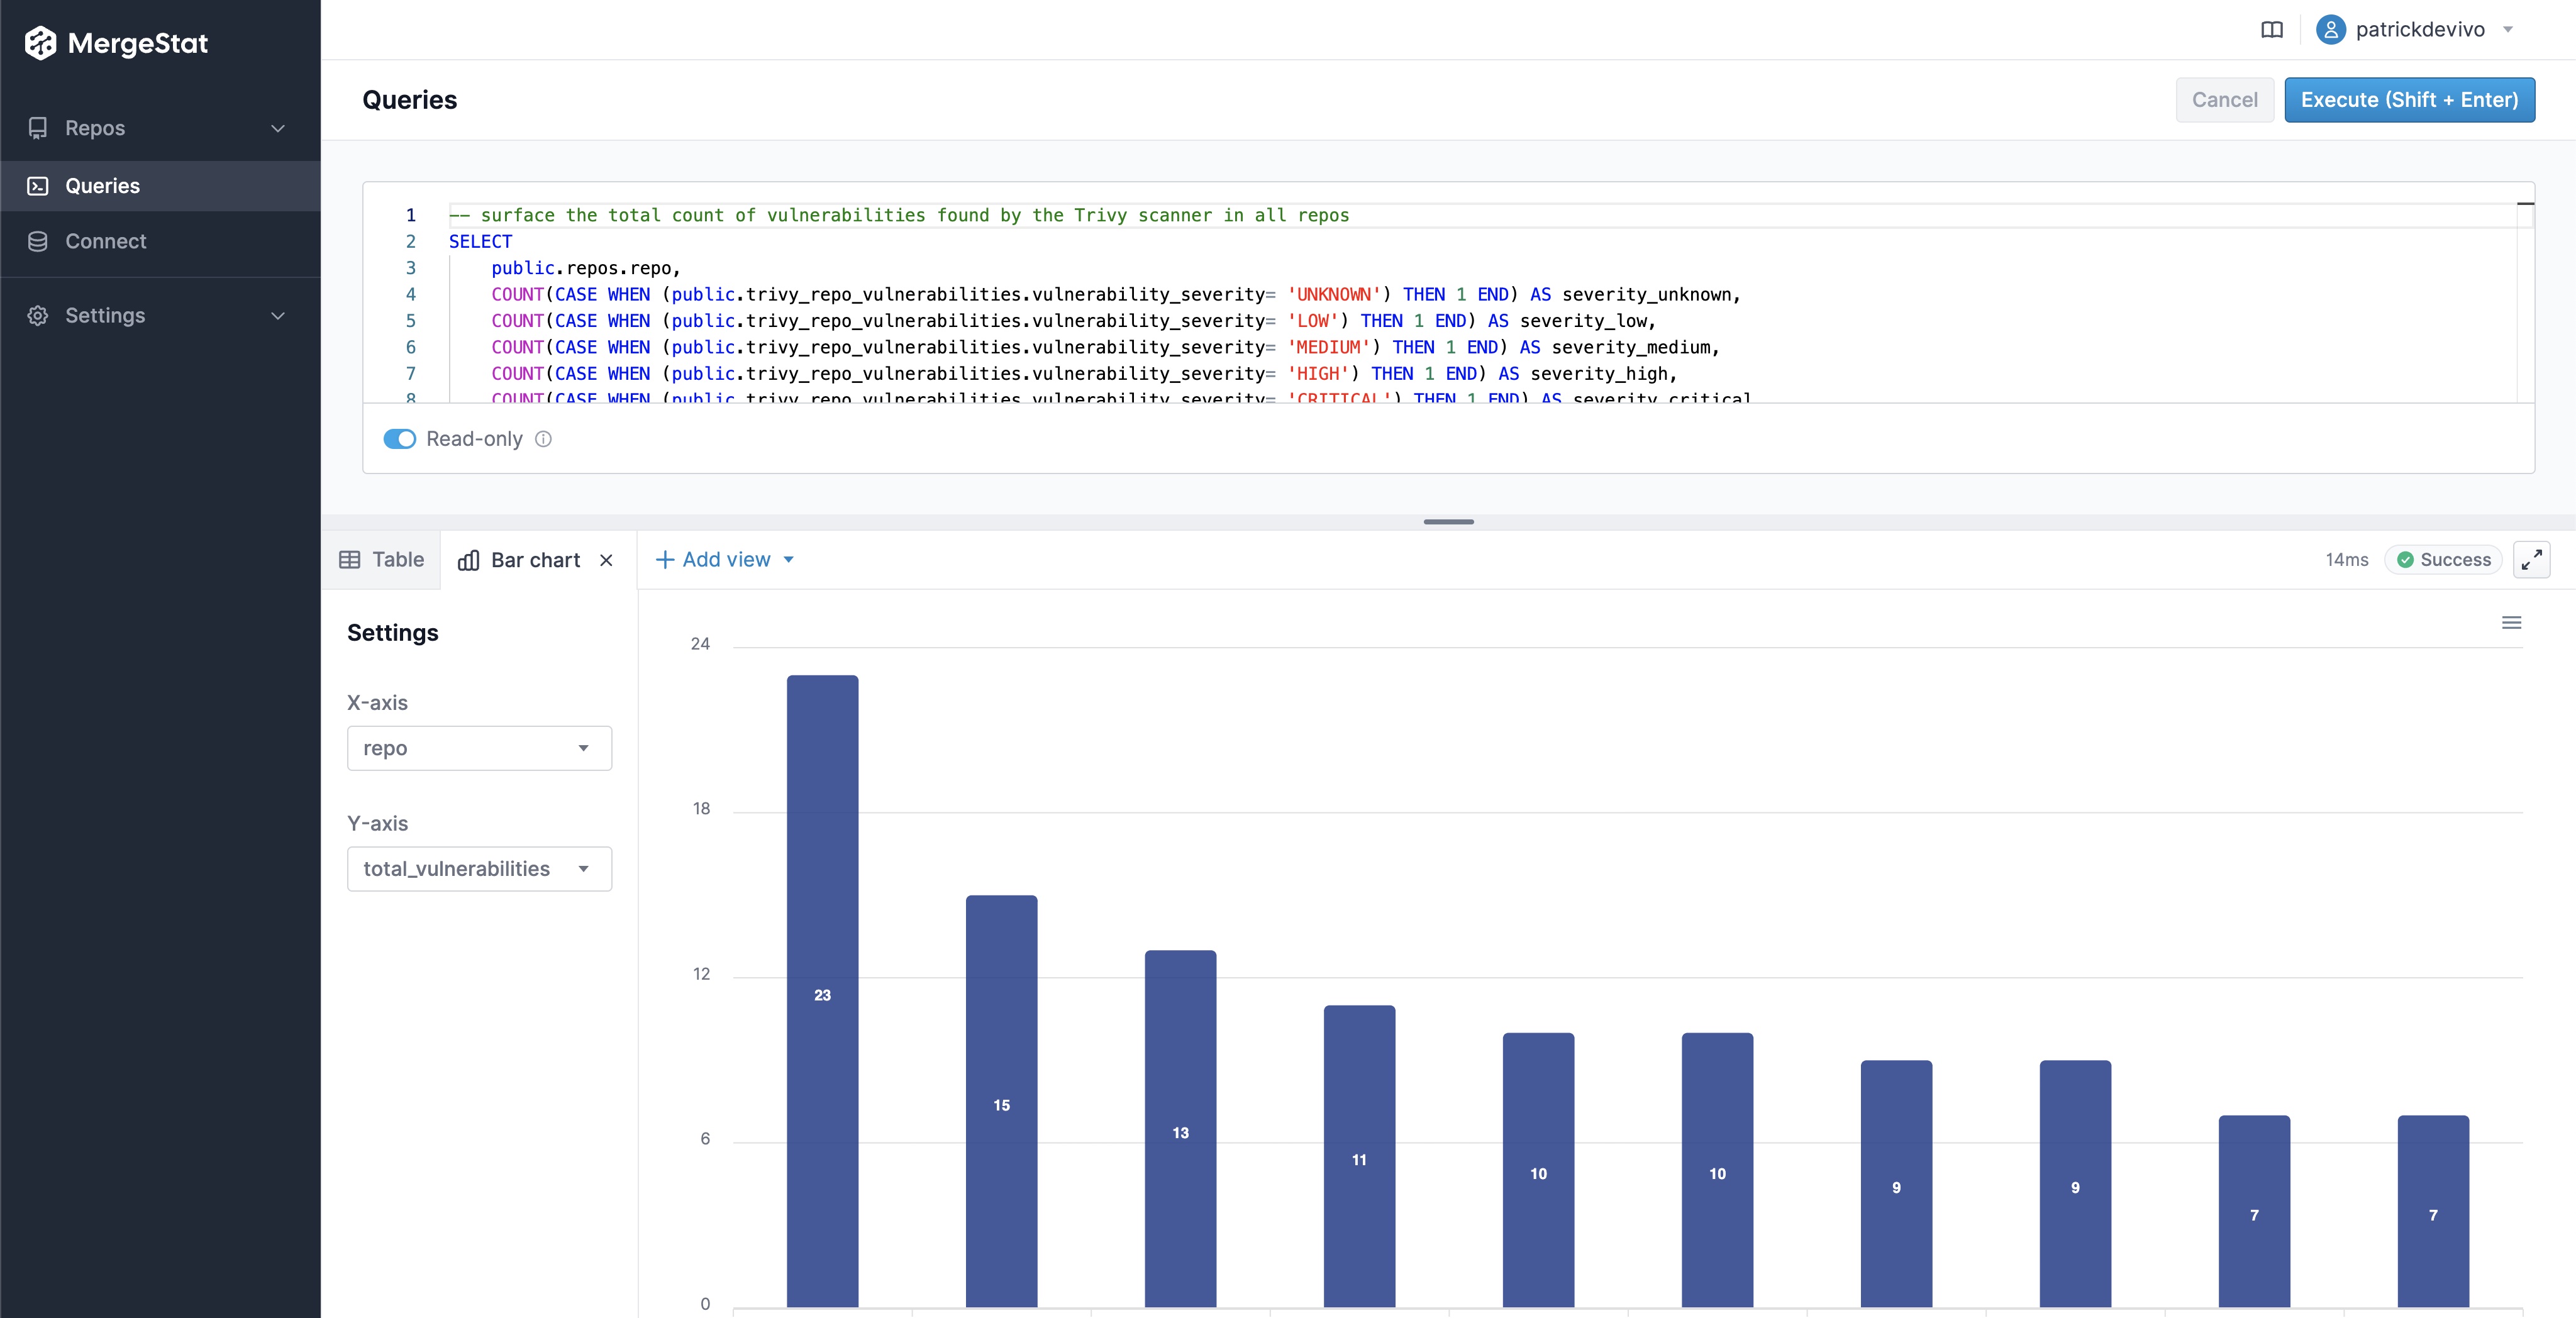
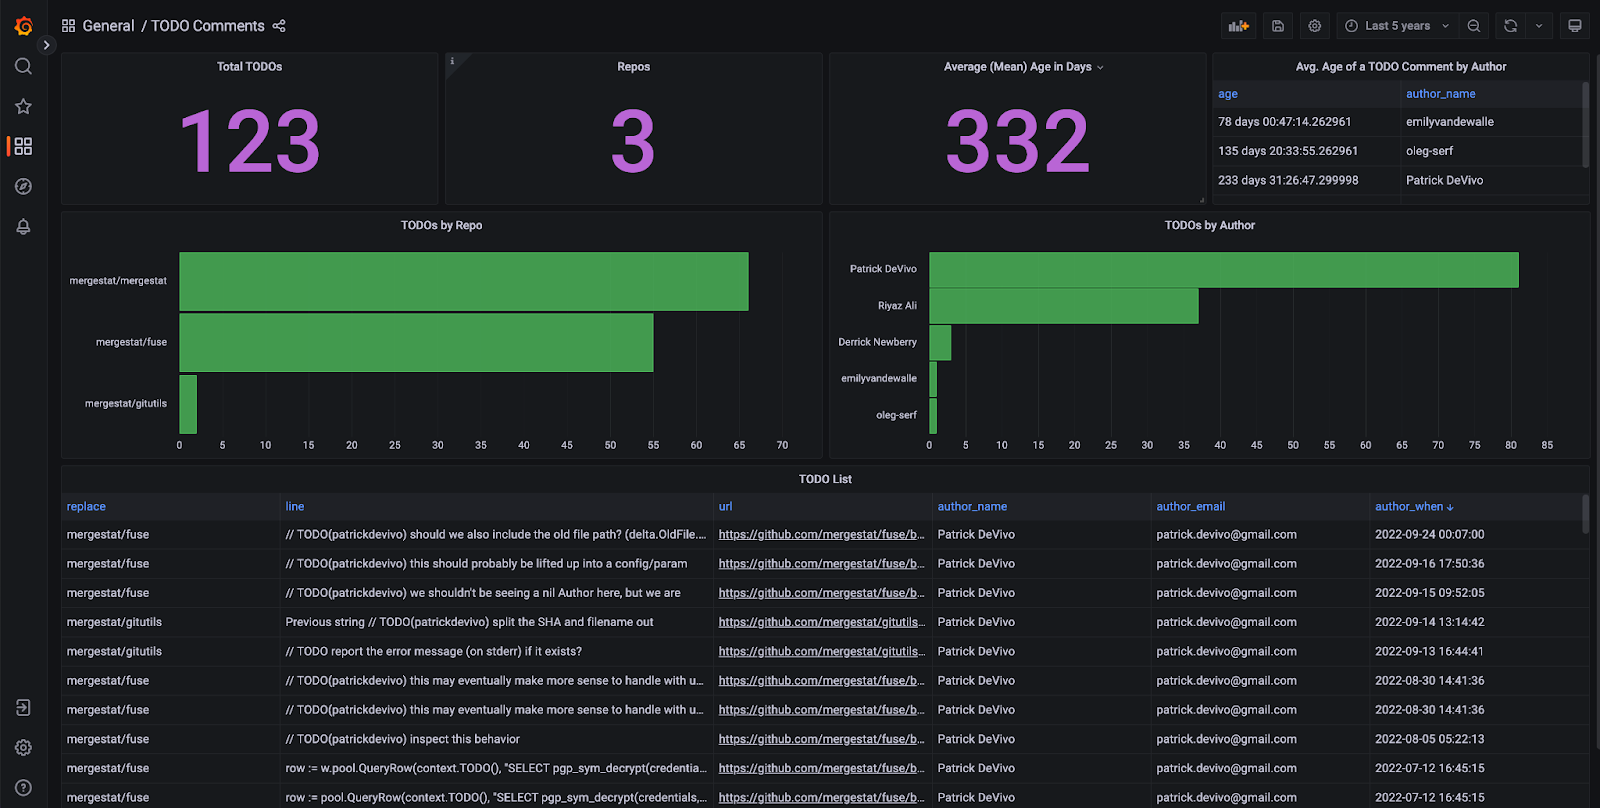
Now, let's see how we can query these vulnerabilities to get a sense of where (what repos) we have the most vulnerabilities in, and what the severity make up looks like.

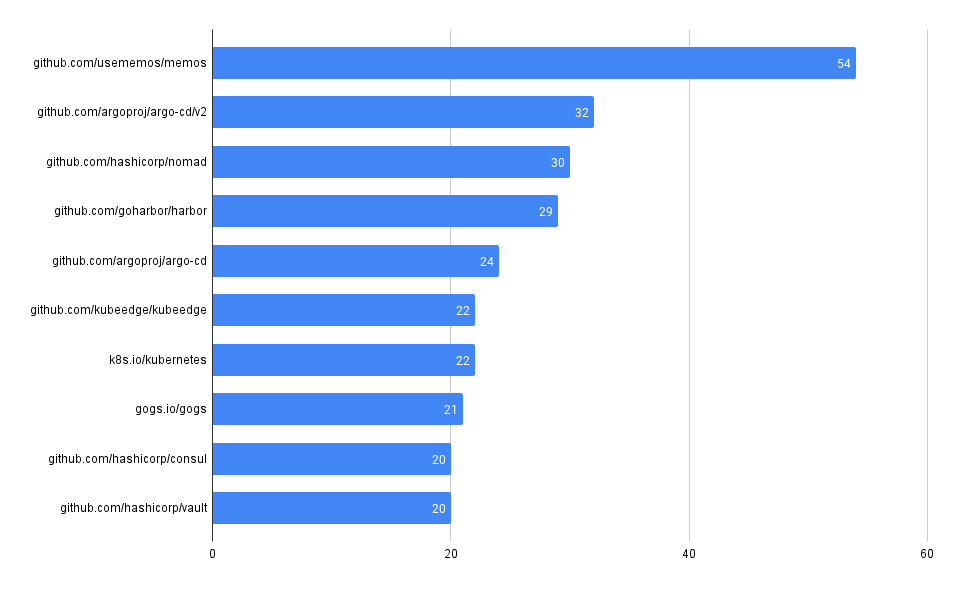
Total Vulnerability Count by Repo

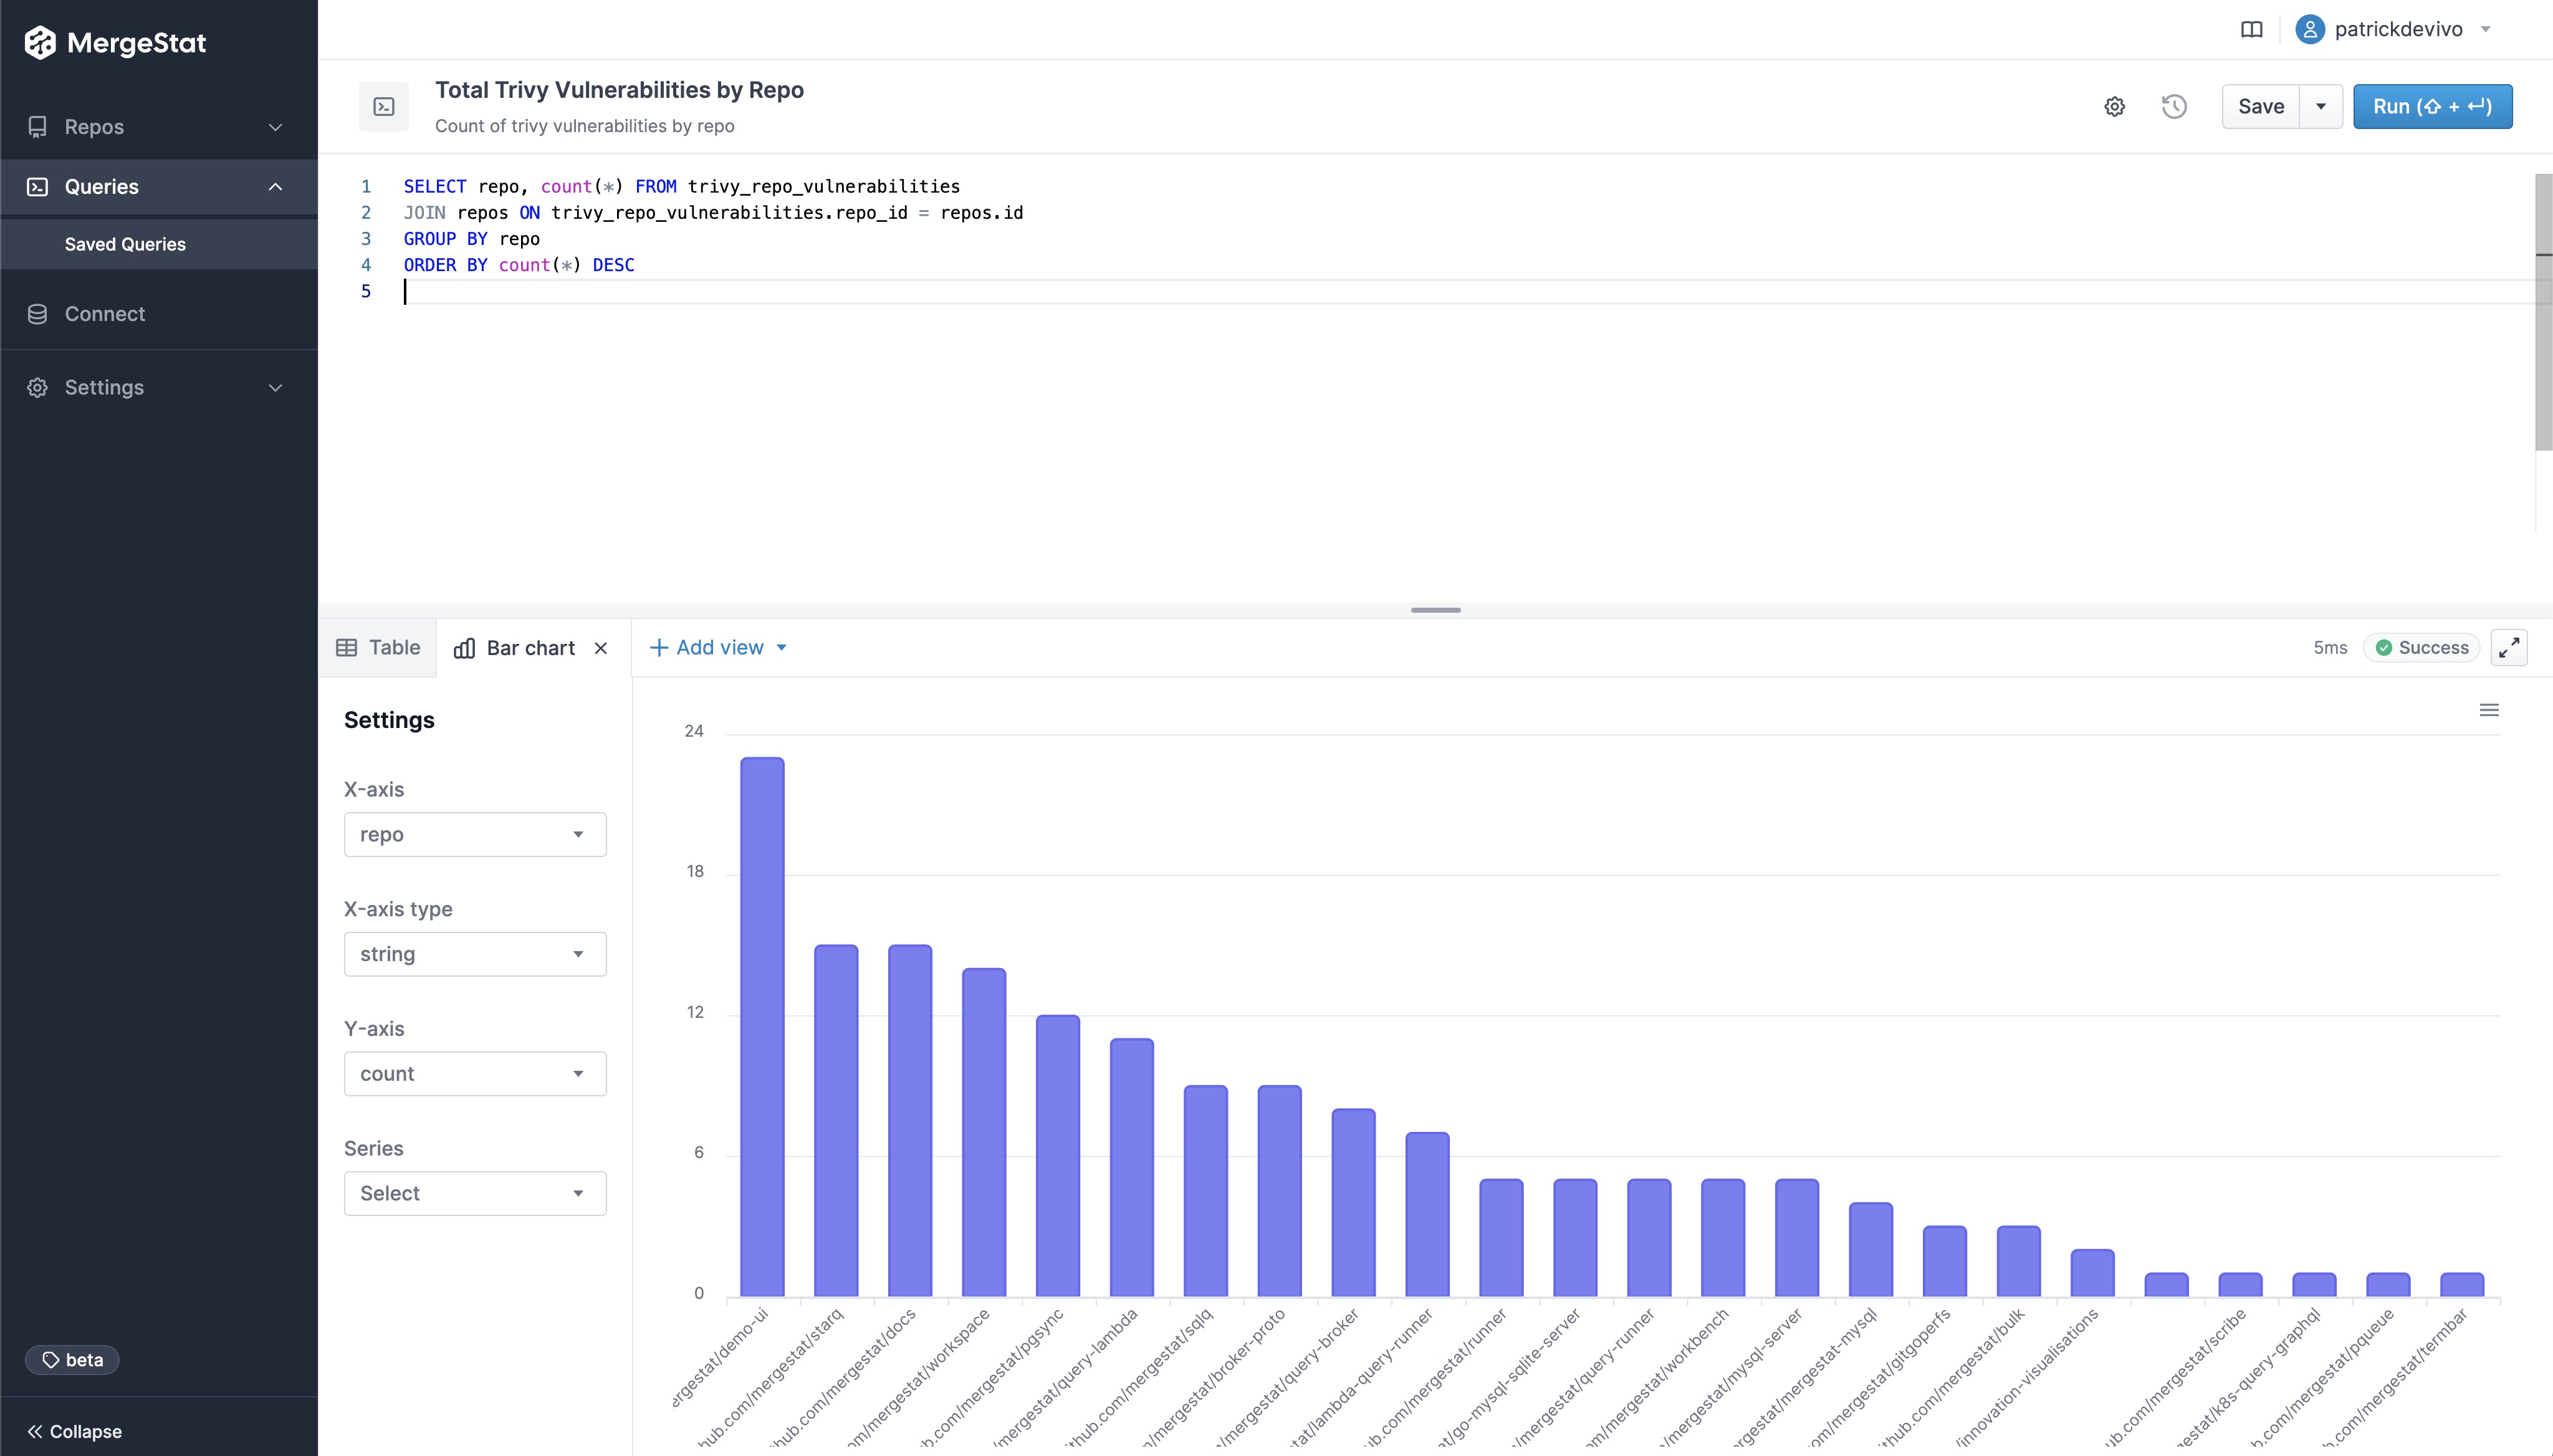
These queries look at the total counts of vulnerabilities surfaced in each of the codebases in MergeStat.

-- Count of trivy vulnerabilities by repo
SELECT repo, count(*) FROM trivy_repo_vulnerabilities
JOIN repos ON trivy_repo_vulnerabilities.repo_id = repos.id
GROUP BY repo
ORDER BY count(*) DESC
-- Count of grype vulnerabilities by repo
SELECT repo, count(*) FROM grype_repo_vulnerabilities
JOIN repos ON grype_repo_vulnerabilities.repo_id = repos.id
GROUP BY repo
ORDER BY count(*) DESC

Trivy vulnerabilities by repo

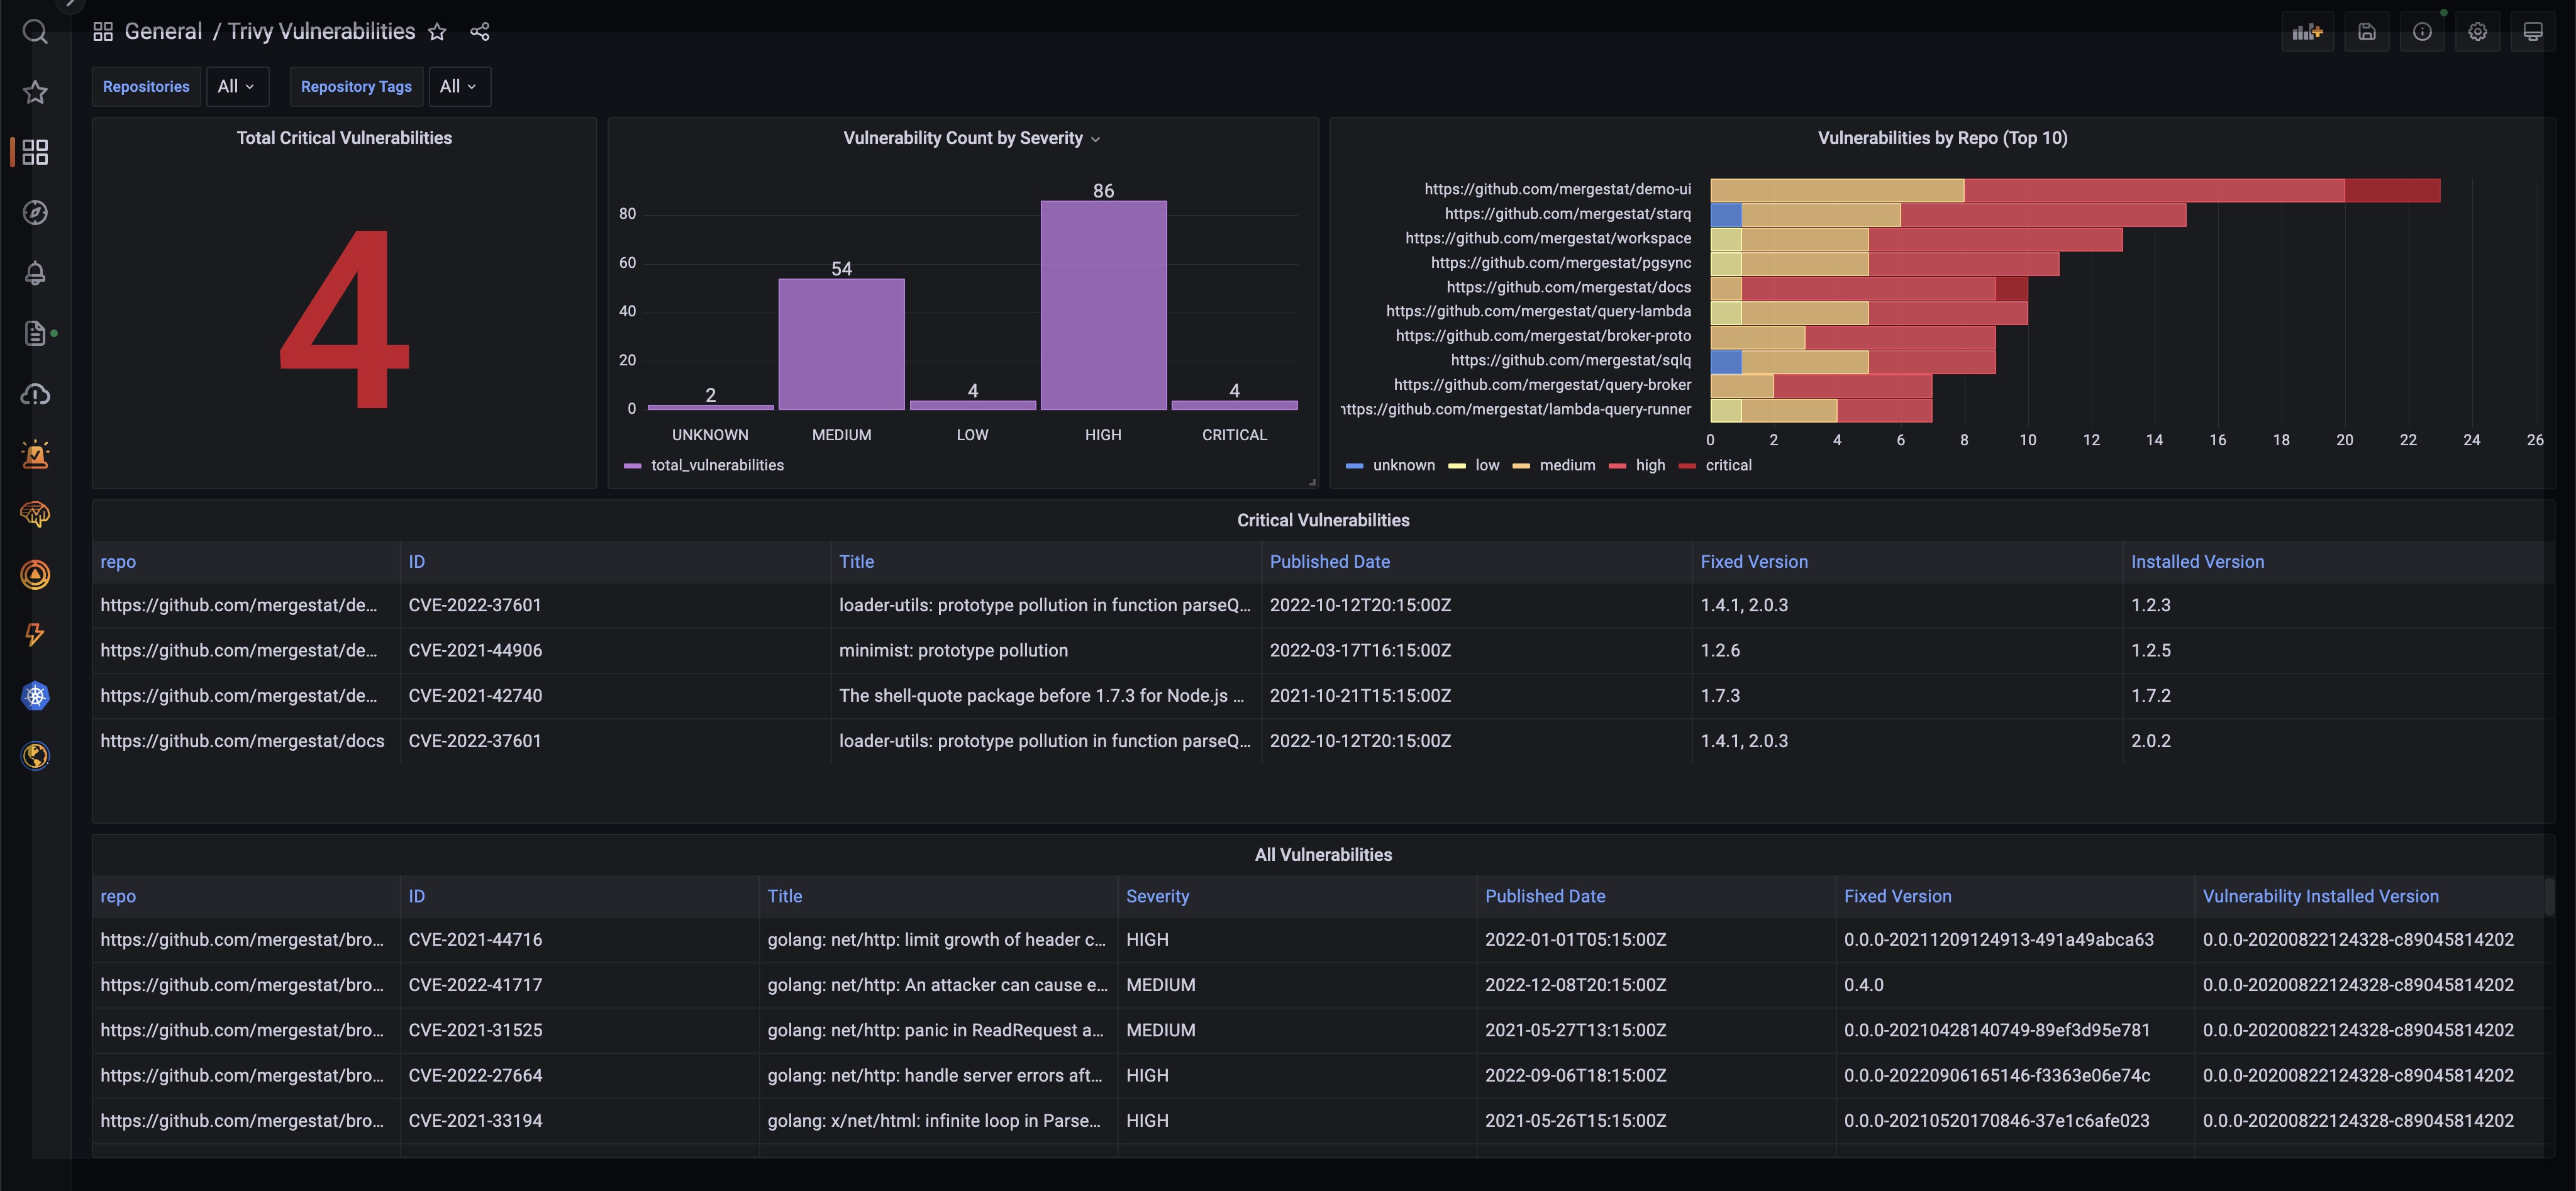
Vulnerability Count by Repo & Severity

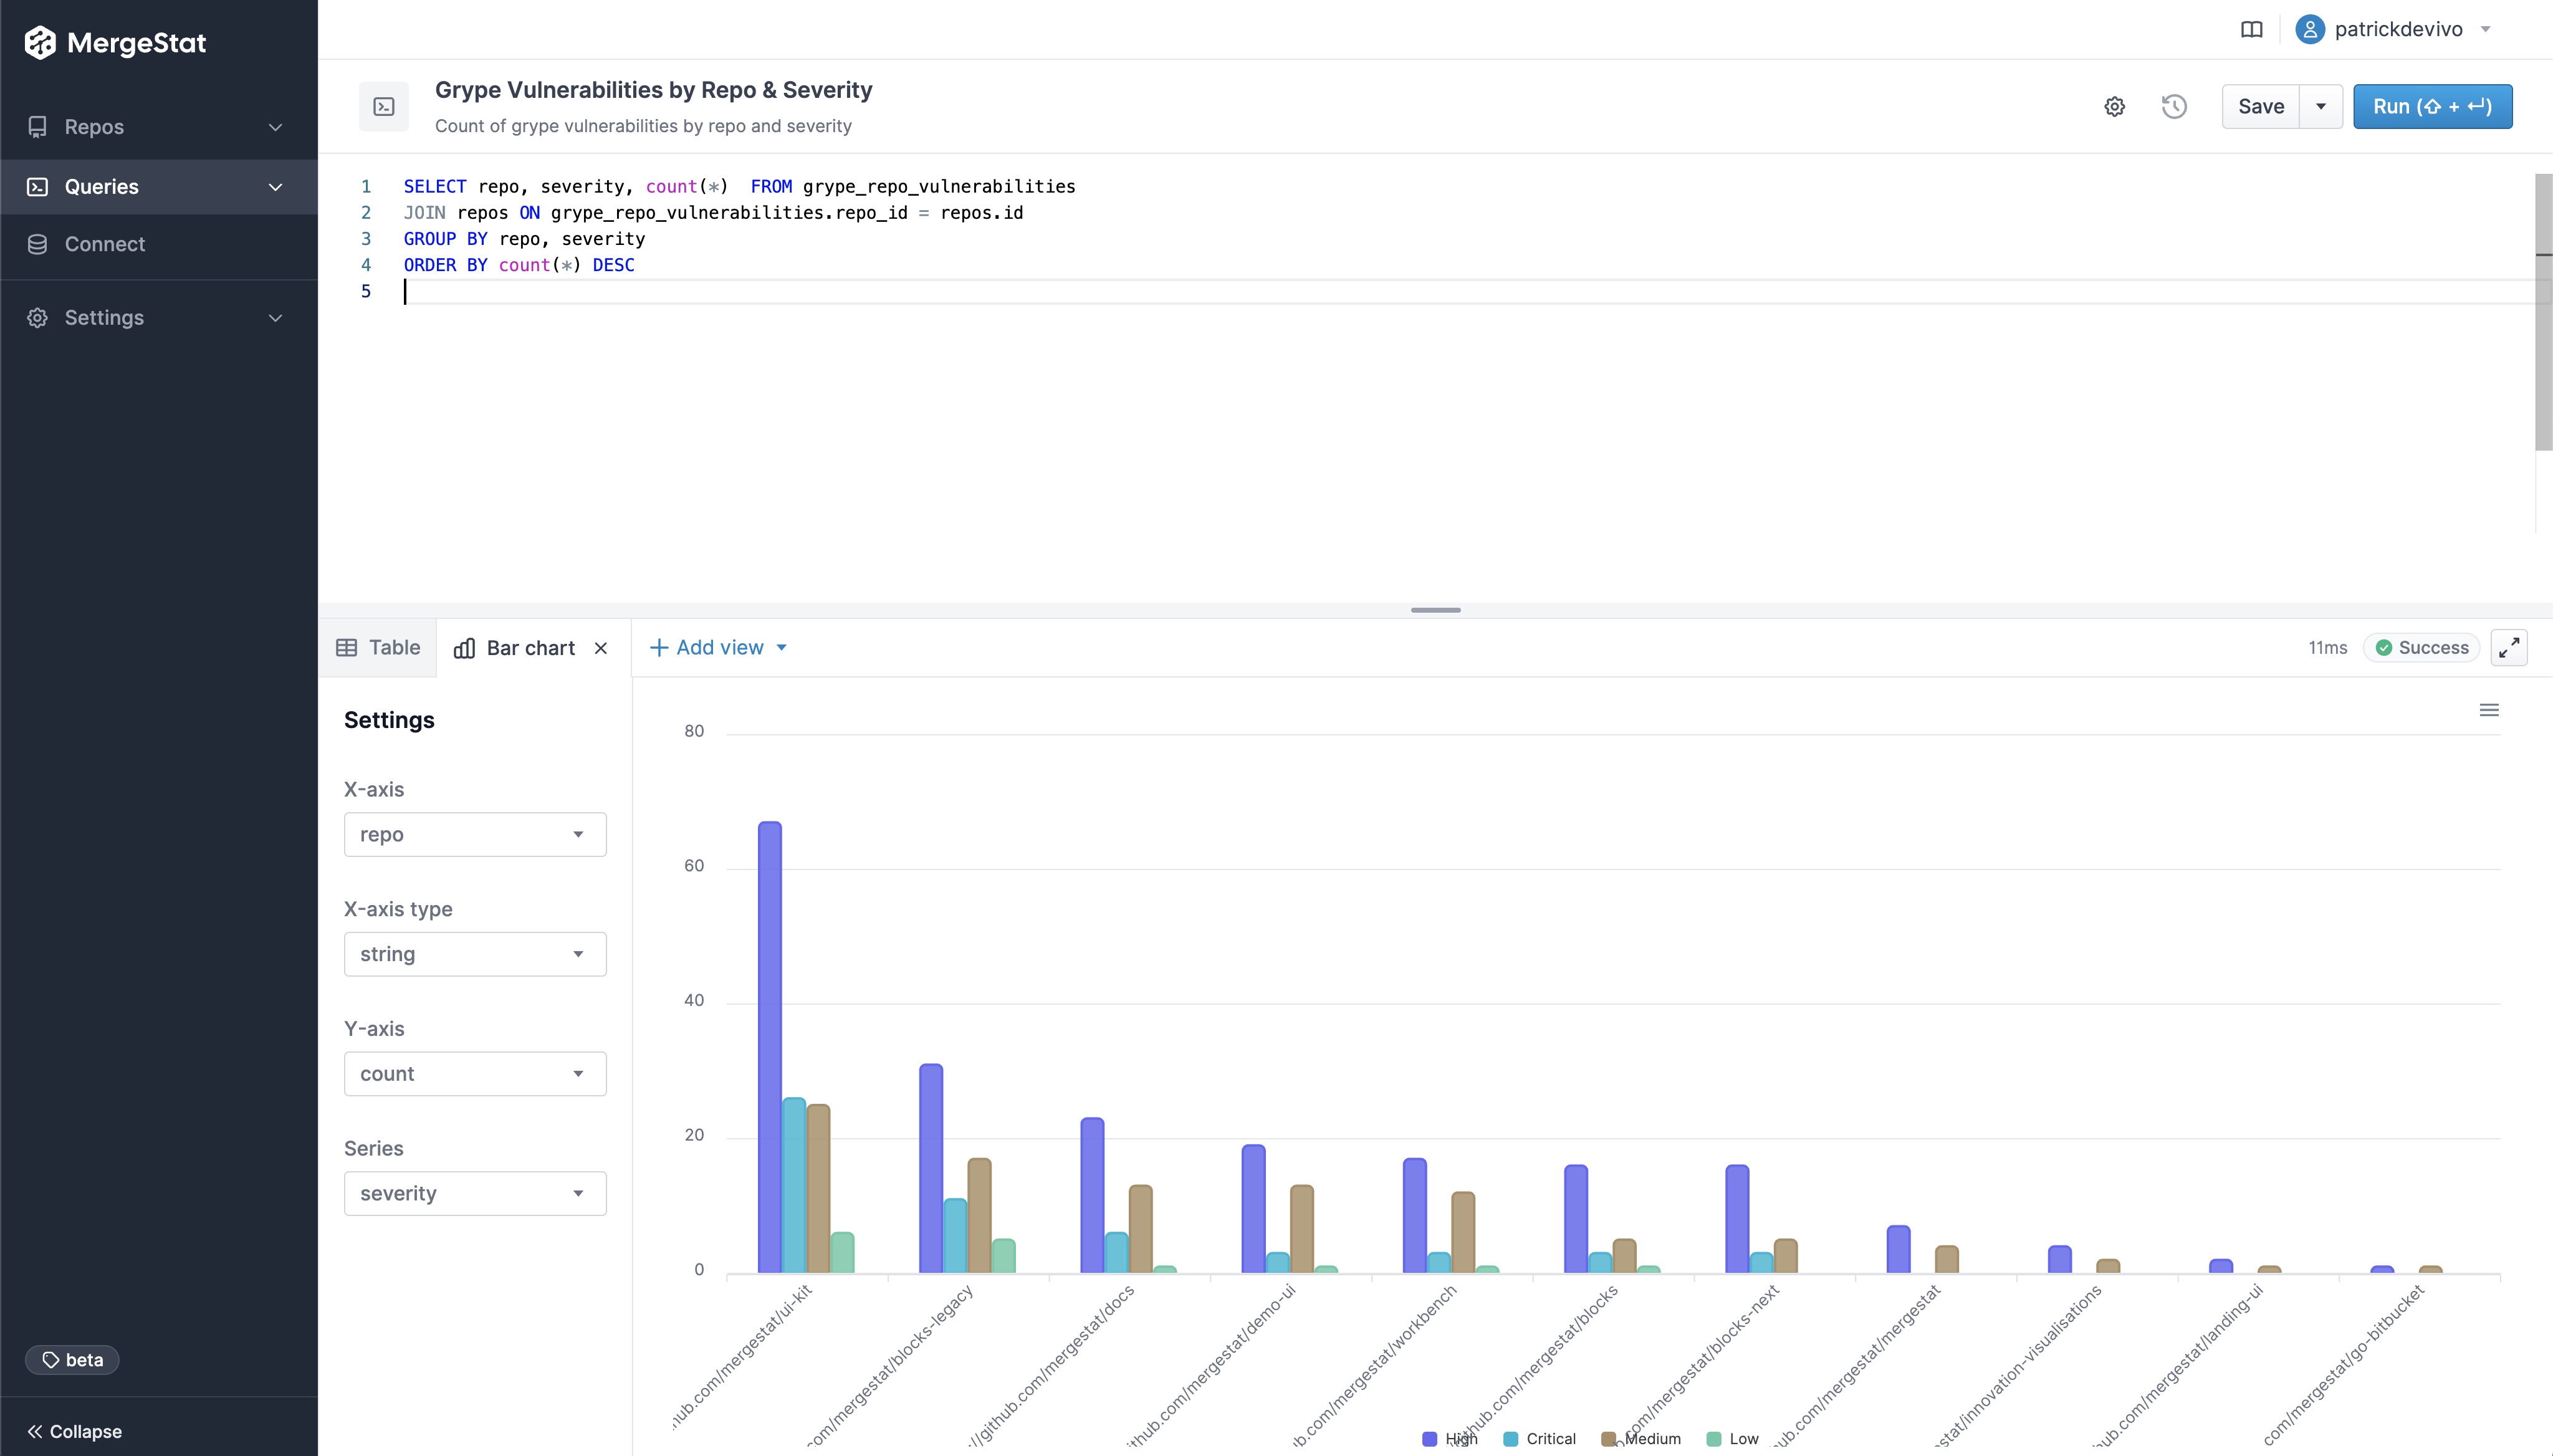
These queries break out the count of vulnerabilities across codebase and severity.

-- Count of grype vulnerabilities by repo and severity
SELECT repo, severity, count(*) FROM grype_repo_vulnerabilities
JOIN repos ON grype_repo_vulnerabilities.repo_id = repos.id
GROUP BY repo, severity
ORDER BY count(*) DESC
-- Count of trivy vulnerabilities by repo and severity
SELECT repo, vulnerability_severity, count(*) FROM trivy_repo_vulnerabilities
JOIN repos ON trivy_repo_vulnerabilities.repo_id = repos.id
GROUP BY repo, vulnerability_severity
ORDER BY count(*) DESC

Vulnerability count by repo and severity

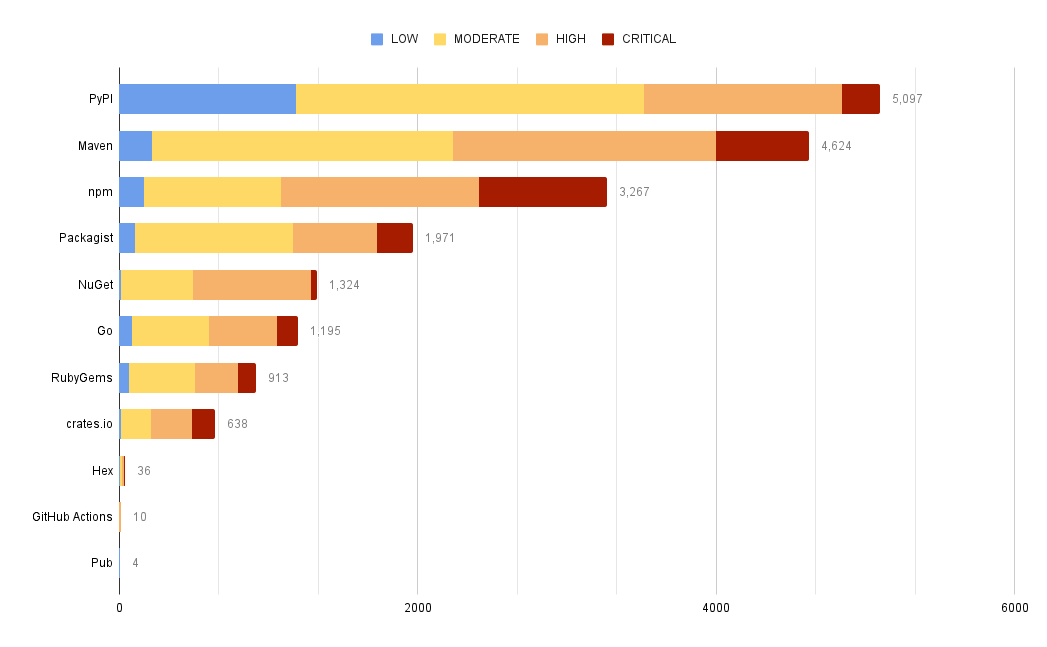
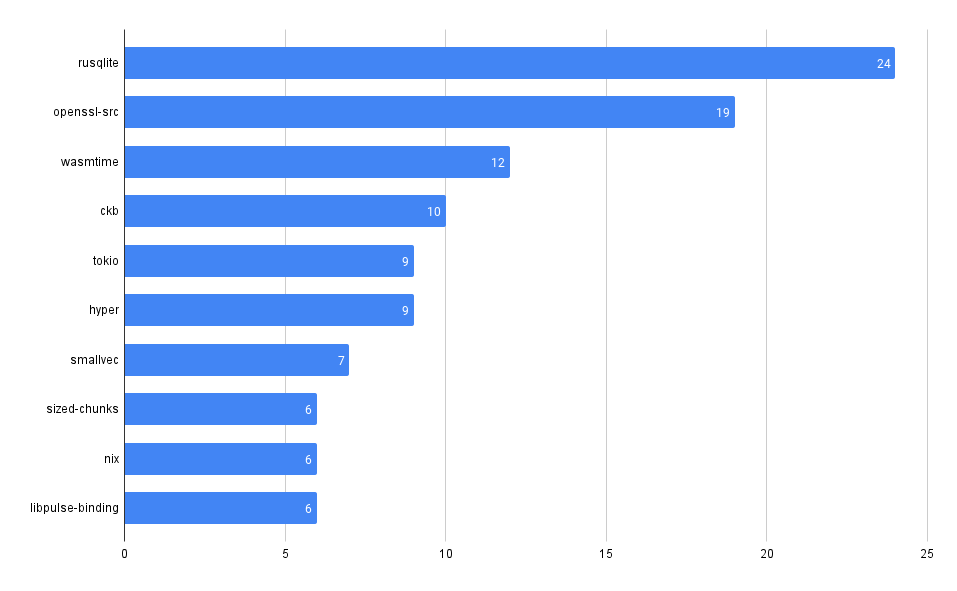
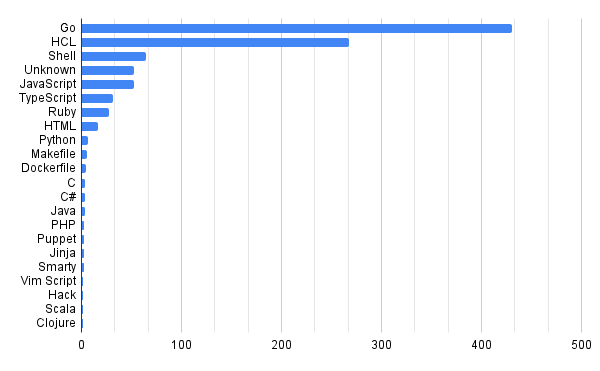
Vulnerability Count by Type

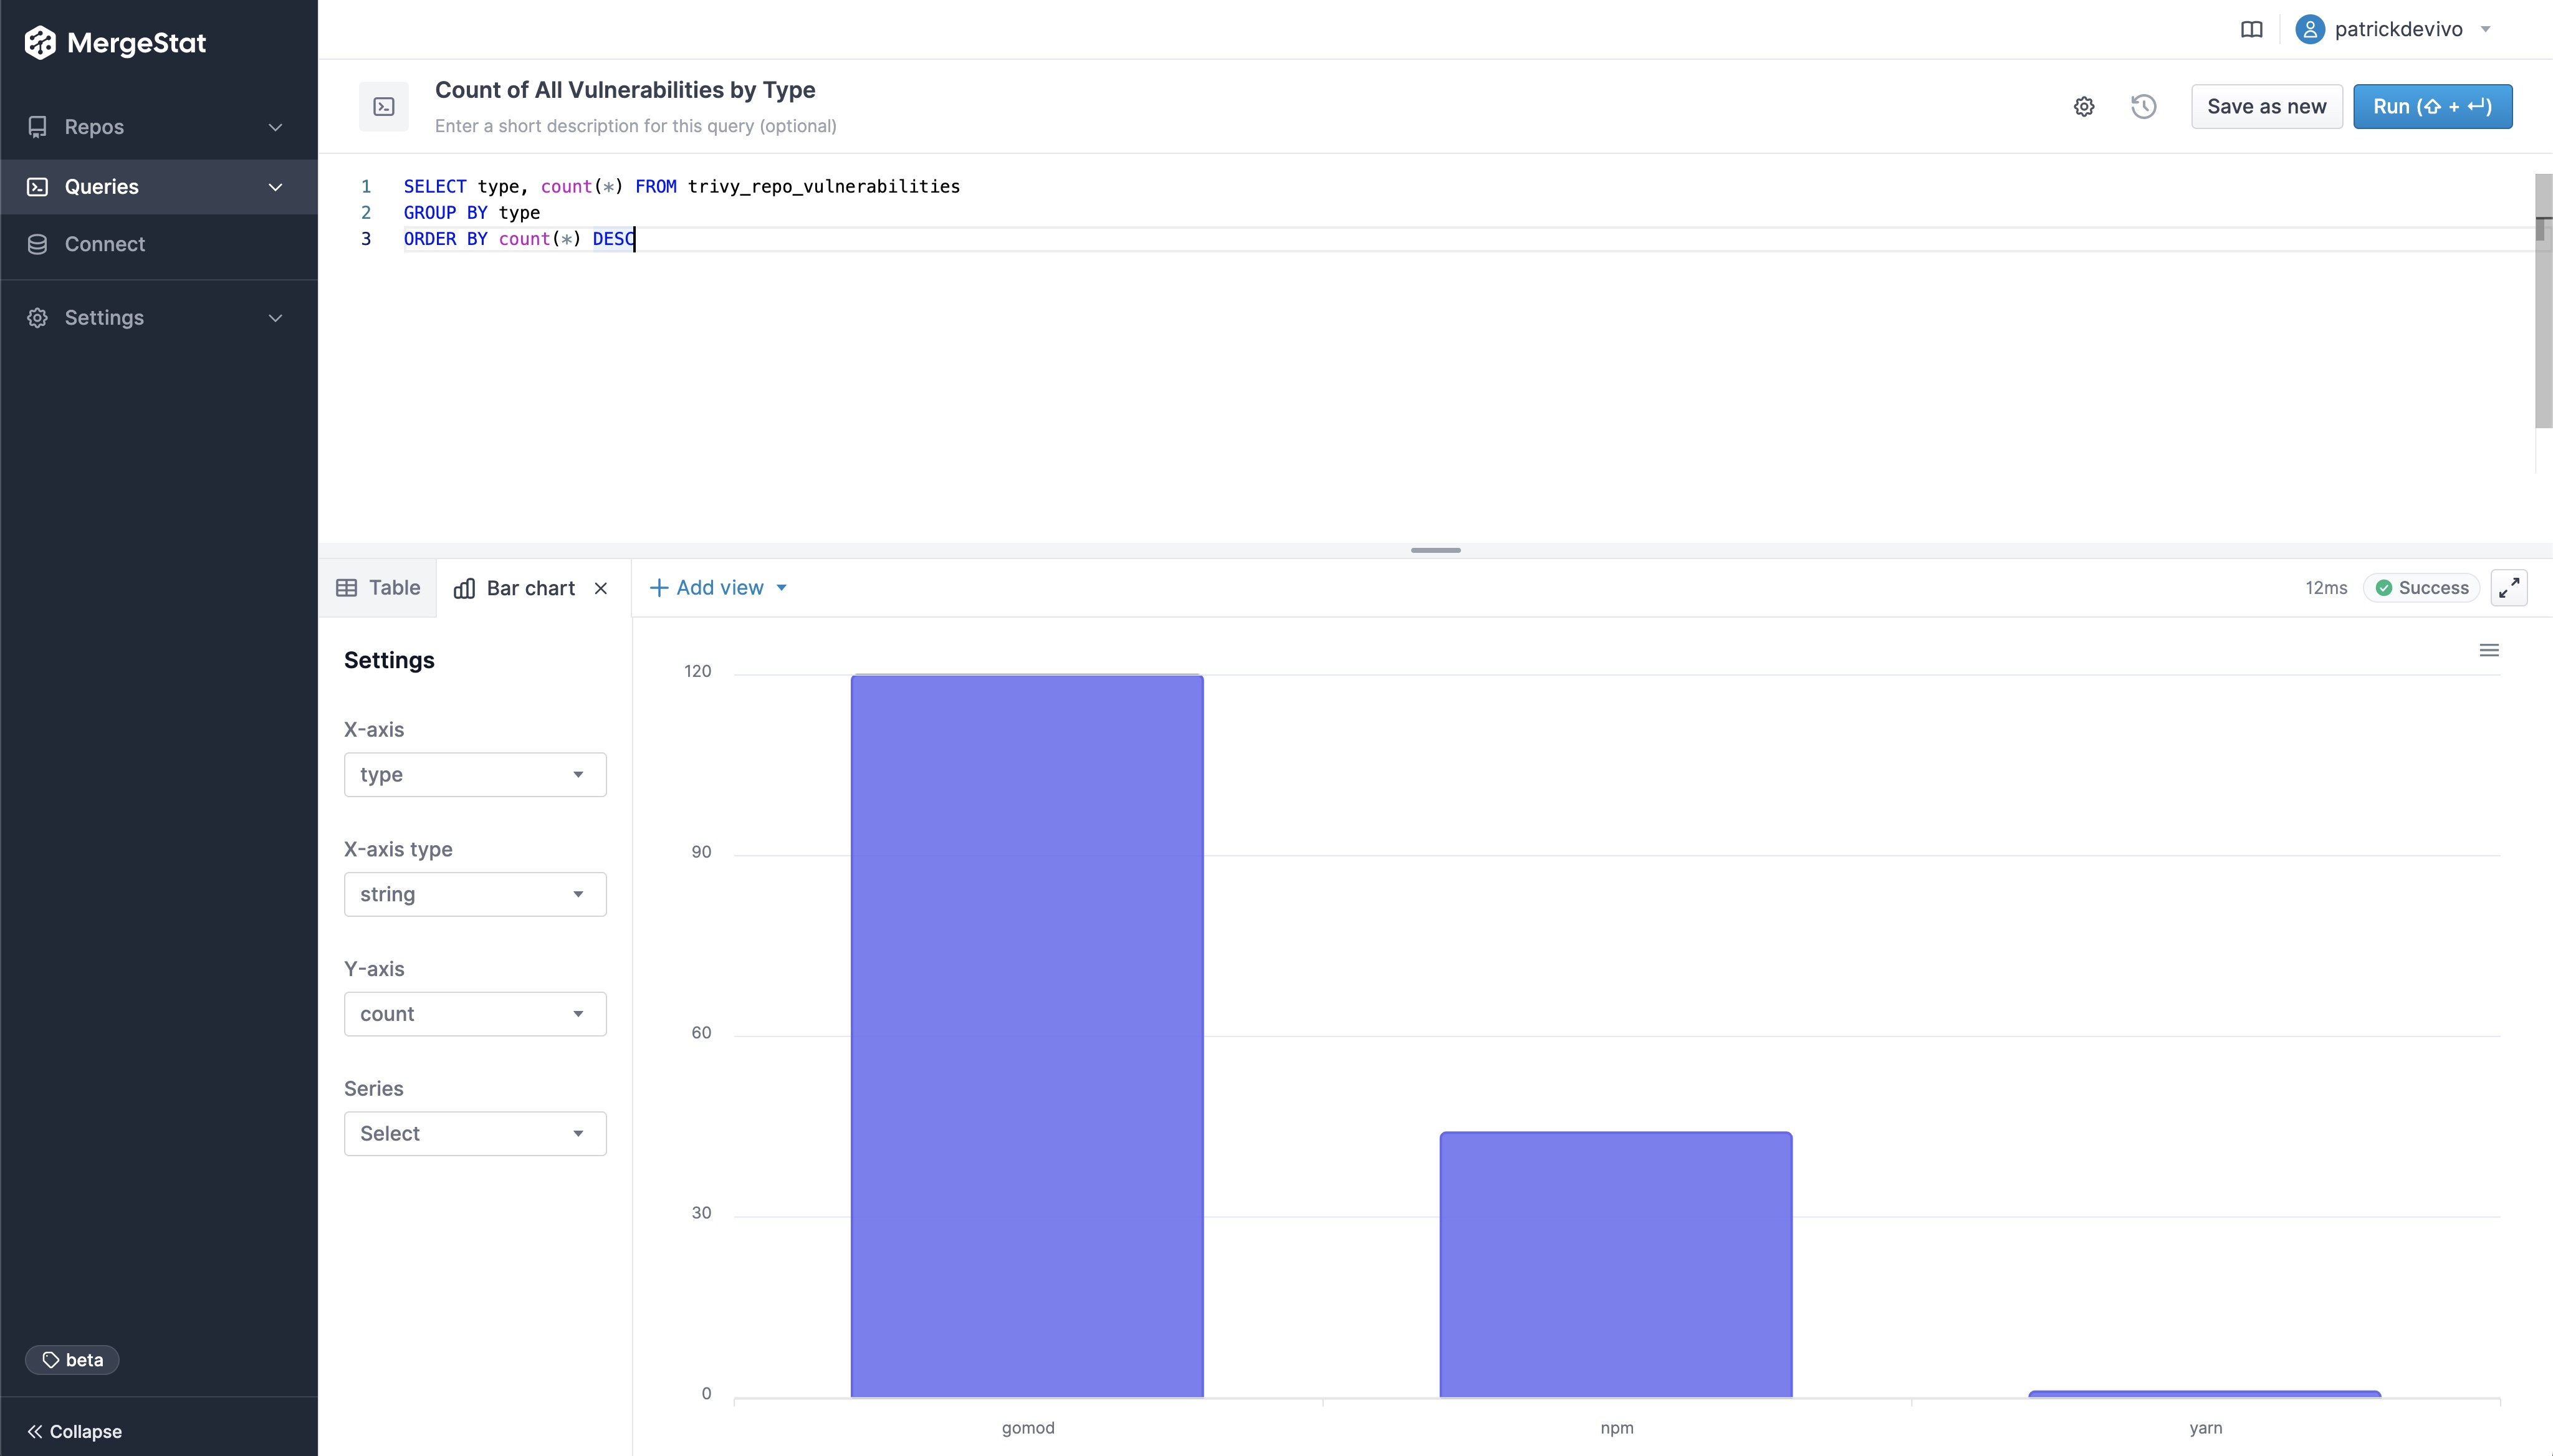
Look at the breakdown of vulnerability counts by "type" (package ecosystem).

note

Interestingly, Grype reports more npm vulnerabilities while Trivy reports more gomod vulnerabilities across our repos.

-- Count of trivy vulnerabilities by type
SELECT type, count(*) FROM trivy_repo_vulnerabilities
GROUP BY type
ORDER BY count(*) DESC
-- Count of grype vulnerabilities by type
SELECT type, count(*) FROM grype_repo_vulnerabilities
GROUP BY type
ORDER BY count(*) DESC

Trivy vulnerabilities by type

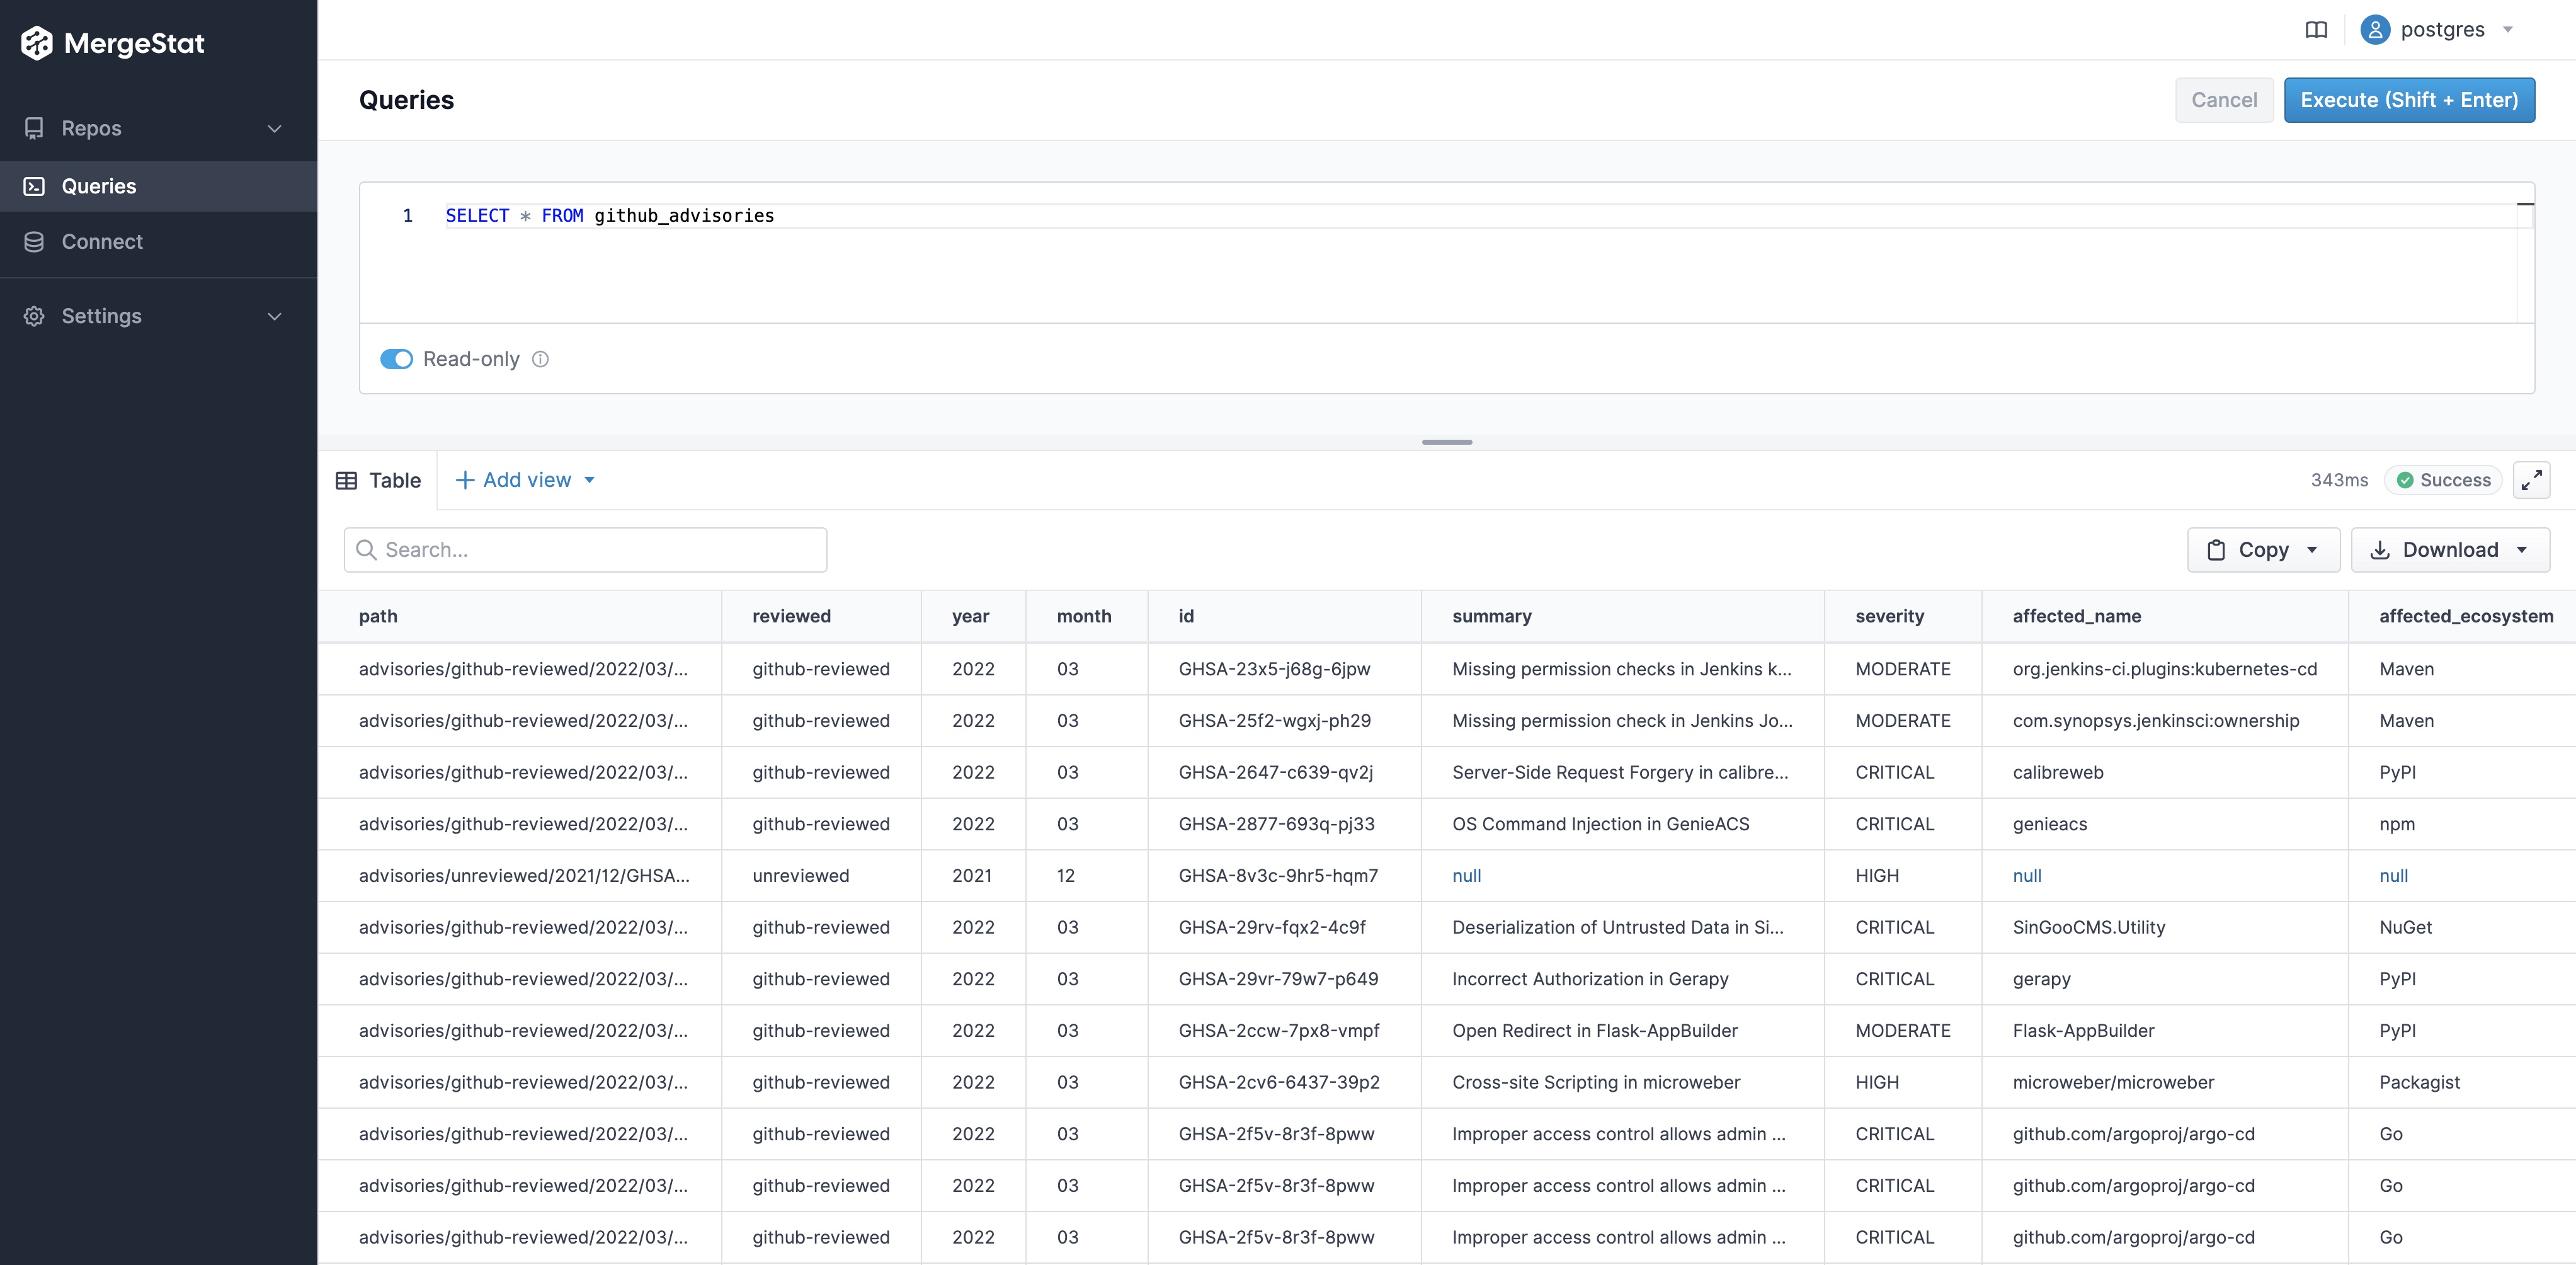
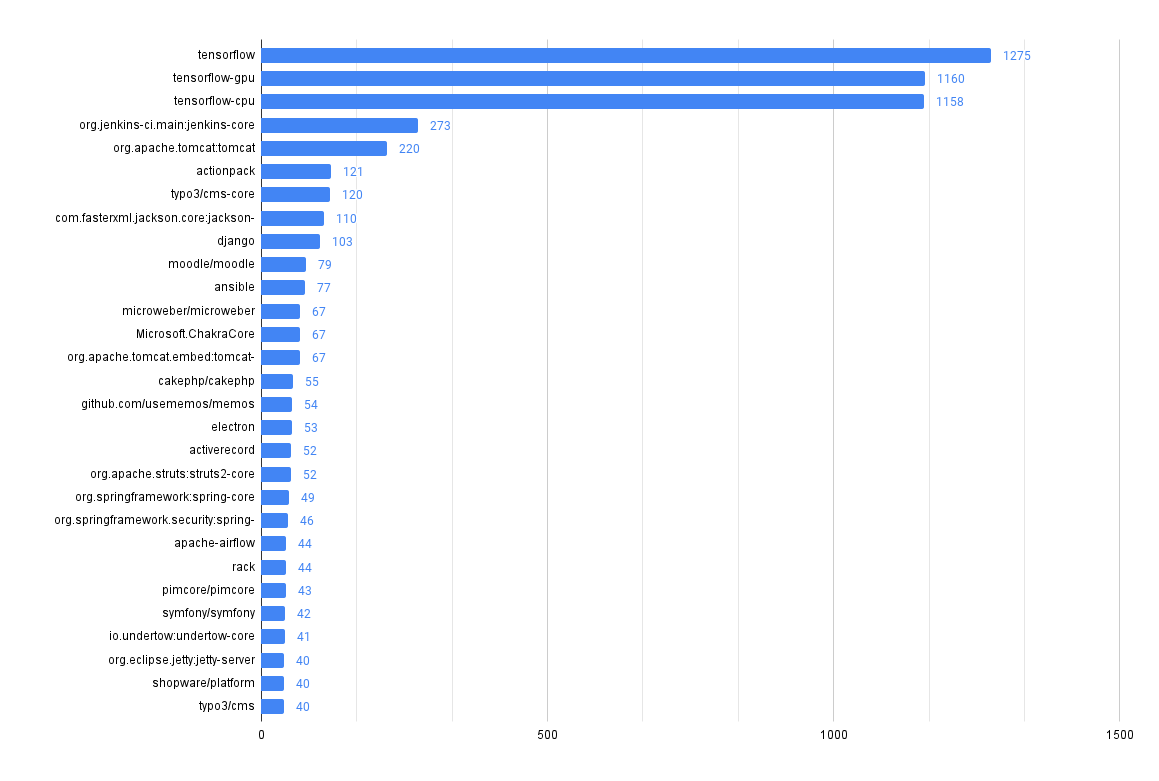
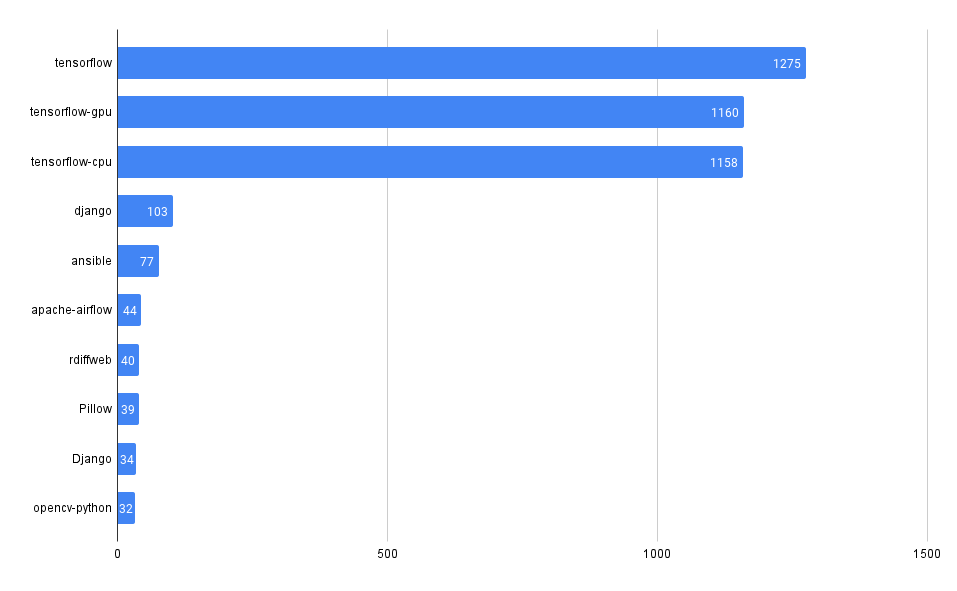
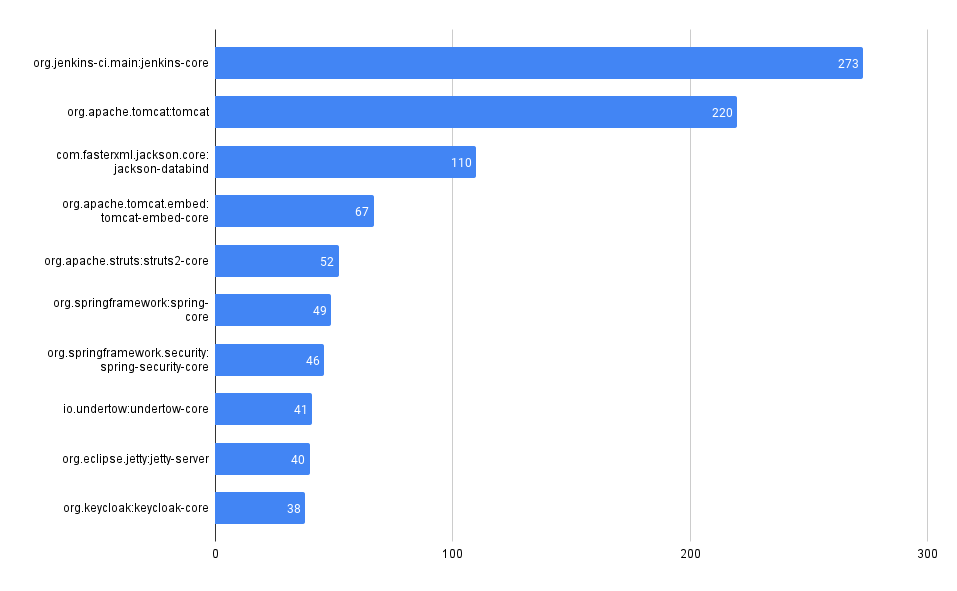
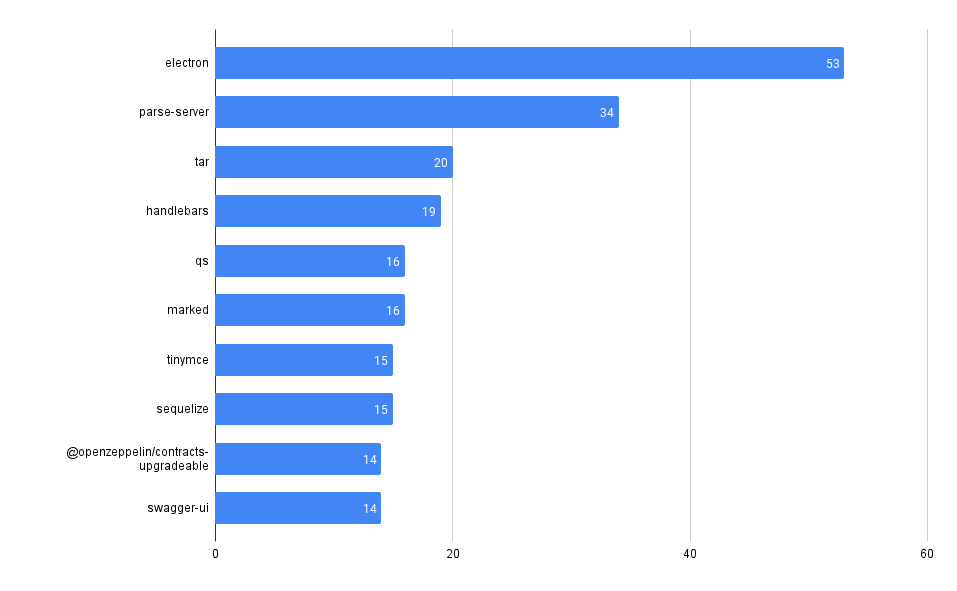
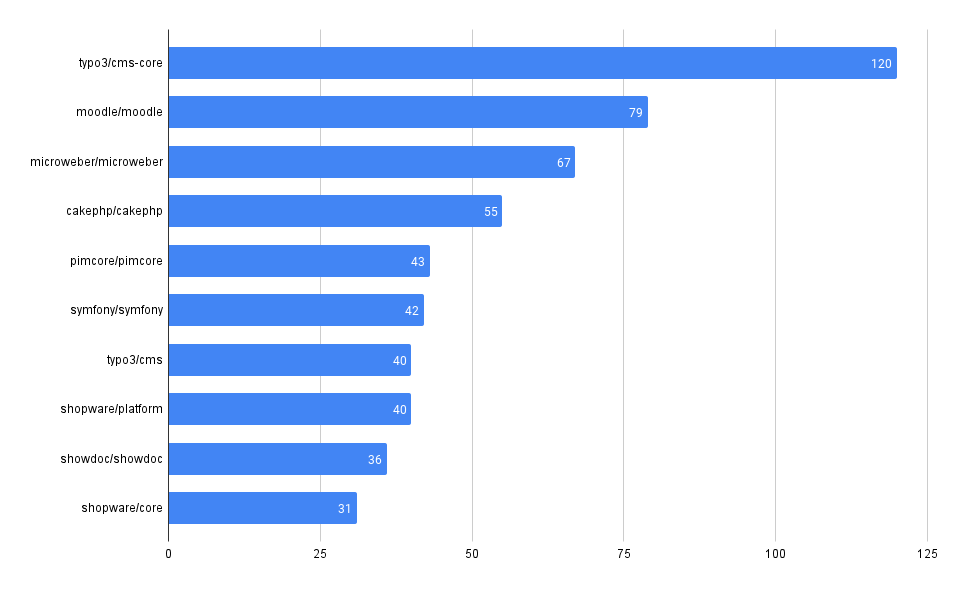
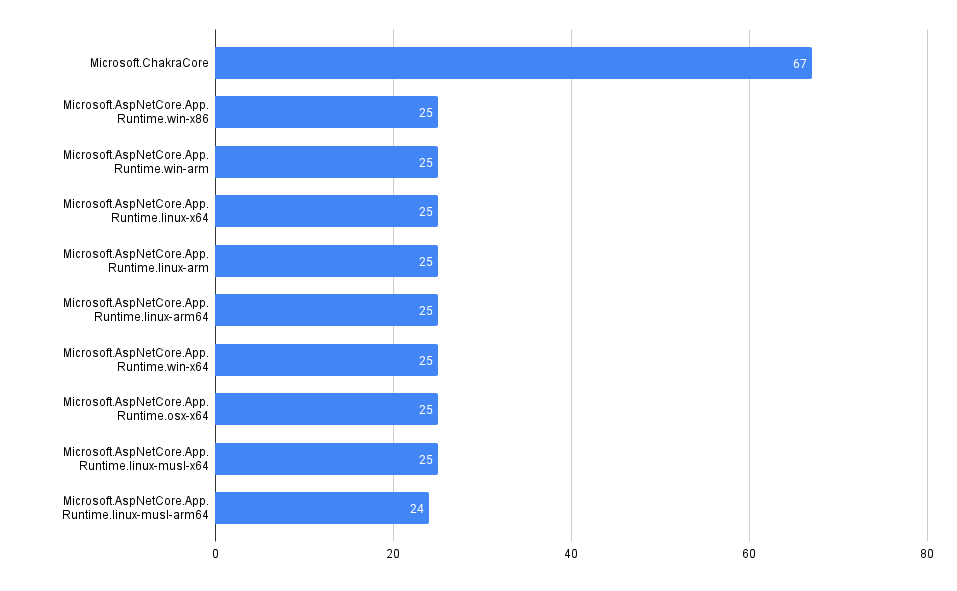
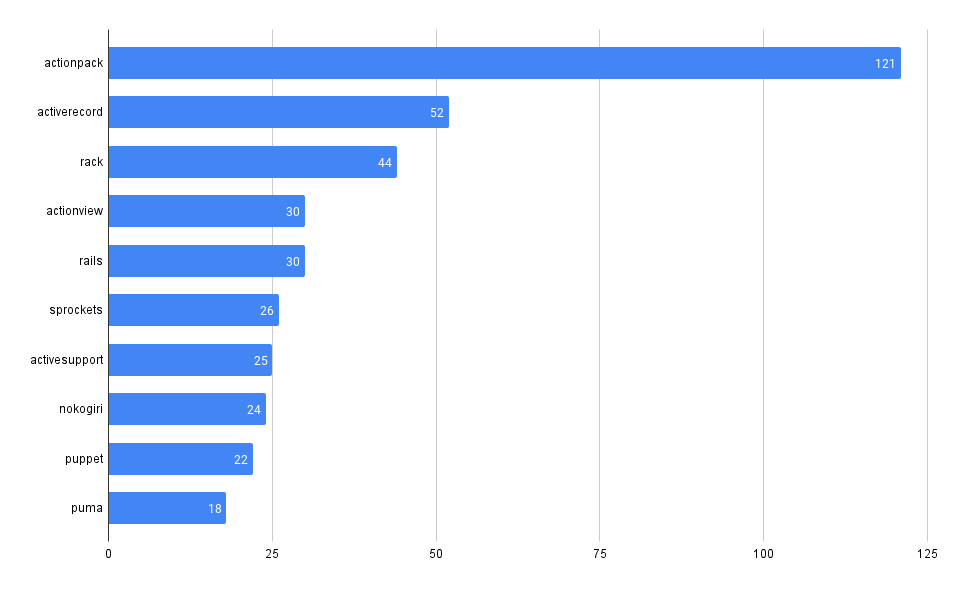
Most Common Vulnerabilities

Find which vulnerabilities you're most exposed to by surfacing the most commonly found ones (by CVE ID) in your codebases.

-- Count of trivy vulnerabilities by id
SELECT count(*) vulnerability_id, vulnerability_title, type FROM trivy_repo_vulnerabilities
GROUP BY vulnerability_id, vulnerability_title, type
ORDER BY count(*) DESC
-- Count of grype vulnerabilities by id
SELECT count(*), id, description, type FROM grype_repo_vulnerabilities
GROUP BY id, description, type
ORDER BY count(*) DESC

Additional Exploration

Hopefully these queries and screenshots give a sense of what's possible when it comes to understanding CVEs across your organization using MergeStat SQL. Some additional queries and explorations that could be interesting:

  • Join CVE data with Git activity to order by the recency of commits in code (filter out abandoned codebases where the last commit was over a year ago)
  • Determine if certain teams or projects do a better job at managing CVEs
  • Alert when new CRITICAL vulnerabilities are detected using a direct SQL integration
  • Connect a BI tool directly to the MergeStat PostgreSQL instance to see vulnerability data in a single dashboard
Join our Slack

If this you find this interesting and want to dig deeper on CVE data with us, hop in our community Slack! We're always happy to chat about MergeStat there 🎉.

note

Today, repo data sources are defined in the MergeStat code. We're working on support for a "bring your own" tool approach that would enable anyone to configure their own scanners or scripts in MergeStat.

Patrick DeVivo

We're excited to announce that the most recent releases of MergeStat now include basic data visualization capabilities - try it out!

Example of a bar chart in the MergeStat UI

We're starting small, with simple support for line charts 📈 and bar charts 📊 in our SQL execution interface. We've also added a single metric view type which will feed into the dashboarding capabilities we have planned (along with our other chart types).

This has been one of the more frequently requested features from our early users, as it now means you don't have to bring in another BI tool (such as Grafana, Metabase, Superset, etc.) to visualize the data in your MergeStat instance. Support for direct SQL access is not going anywhere however, and nothing prevents more robust data visualizations in other tools.

Example of MergeStat data visualization in Grafana Example of MergeStat data visualization in Grafana

Keep a Lookout for:

  • More chart types, such as scatter plots and pie/donut charts
  • More chart options and customization abilities
  • Saved queries and visualizations for easier reuse
  • Dashboard composition for putting together dynamic, SQL-driven reports on MergeStat data
Join our Slack

Our community Slack is a great place to find help and ask questions. We're always happy to chat about MergeStat there 🎉!

Patrick DeVivo

Did you know that GitHub maintains a public database of known CVEs and security advisories for open-source codebases? The database is a public Git repository that holds JSON files in OSV format, partitioned by date. This is the data that's displayed on the github.com/advisories page, which also powers Dependabot alerts!

Since it's just a Git repo, we wanted to take it for a spin with MergeStat to see what we could learn applying some SQL to its contents.

Setup

We followed the getting started instructions to get a new local instance of MergeStat running with docker-compose. Since this is a public GitHub repo (and we're looking at the data brought in by the GIT_FILES syncer), we don't need to configure any authentication, we can just bring the repo in directly, and sync the file contents:

Screenshot of the MergeStat app having synced the file contents of the GitHub Advisory Database repo

We started by establishing a view over the "raw" file contents of the repo, which extracts some values from the underlying JSON files and parses their file paths:

-- View of all GitHub Advisories in the repo
CREATE OR REPLACE VIEW github_advisories AS (
SELECT
path,
split_part(path, '/', 2) as reviewed,
split_part(path, '/', 3) as year,
split_part(path, '/', 4) as month,
split_part(path, '/', 5) as id,
contents::jsonb->>'summary' as summary,
contents::jsonb->'database_specific'->>'severity' as severity,
a.value->'package'->'name' as affected_name,
a.value->'package'->'ecosystem' as affected_ecosystem
FROM git_files LEFT JOIN LATERAL jsonb_array_elements(contents::jsonb->'affected') a ON true
WHERE path LIKE 'advisories/%.json'
)

This allows us to run much cleaner queries, such as:

SELECT * FROM github_advisories

Screenshot of the MergeStat app running a SQL query to list all advisories

without needing to carry over the parsing and JSON logic in every query we run.

How many advisories are reviewed vs unreviewed?

SELECT
count(1) as total,
count(1) FILTER (WHERE reviewed = 'github-reviewed') as reviewed,
count(1) FILTER (WHERE reviewed = 'unreviewed') as unreviewed
FROM github_advisories
  • 201,711 total advisories (at time of writing)
  • 19,078 advisories have been reviewed by GitHub (~9% of total)
  • 182,633 remain unreviewed

(Clearly the GitHub team has quite a bit on their plate 😀)

How many advisories exist by ecosystem?

Ecosystem here refers to the package registry the advisory was found in. Looks like PyPi has the most and Pub the least. Note that we're excluding results where an affected ecosystem is not listed.

SELECT
affected_ecosystem,
count(*)
FROM github_advisories
WHERE affected_ecosystem IS NOT NULL -- where the affected ecosystem is known
GROUP BY affected_ecosystem
ORDER BY count(*) DESC

Chart showing the number of advisories by ecosystem

How many advisories exist by ecosystem and severity?

Severity here is one of CRITICAL, HIGH, MODERATE, and LOW.

SELECT
affected_ecosystem,
severity,
count(*)
FROM github_advisories
WHERE affected_ecosystem IS NOT NULL -- where the affected ecosystem is known
GROUP BY affected_ecosystem, severity
ORDER BY count(*) DESC

Chart showing the number of advisories by ecosystem and severity

Some ecosystems have fewer advisories overall, but a higher percentage of those advisories are CRITICAL.

How many advisories have been published over time?

SELECT
extract(year from published) || '-Q' ||extract(quarter from published) as quarter,
count(*)
FROM github_advisories
GROUP by extract(year from published), extract(quarter from published)
ORDER BY extract(year from published) ASC, extract(quarter from published) ASC

Chart showing the number of advisories by publication quarter

Looks like a ton of advisories were published in Q2 2022, making it hard to see overall trends.

What's been the makeup of advisory severity over time?

SELECT
extract(year from published) || '-Q' ||extract(quarter from published) as quarter,
severity,
count(*)
FROM github_advisories
GROUP by extract(year from published), extract(quarter from published), severity
ORDER BY extract(year from published) ASC, extract(quarter from published) ASC

Chart showing the number of advisories by publication quarter and severity

Chart showing the number of advisories by publication quarter and severity, 100% stacked With 100% stacking

What's been the makeup of advisory ecosystem over time?

SELECT
extract(year from published) || '-Q' ||extract(quarter from published) as quarter,
affected_ecosystem,
count(*)
FROM github_advisories
GROUP by extract(year from published), extract(quarter from published), affected_ecosystem
ORDER BY extract(year from published) ASC, extract(quarter from published) ASC

Chart showing the number of advisories by publication quarter and ecosystem

(Where the ecosystem is known).

What packages have the most advisories?

SELECT affected_name, affected_ecosystem, count(*)
FROM github_advisories
WHERE affected_ecosystem IS NOT NULL
GROUP BY affected_name, affected_ecosystem
ORDER BY count(*) DESC

Chart showing the number of advisories by package

Looks like there's a lot going on in tensorflow!

What packages have the most advisories, by ecosystem?

SELECT affected_name, affected_ecosystem, count(*)
FROM github_advisories
WHERE affected_ecosystem IS NOT NULL AND affected_ecosystem = 'REPLACE_WITH_ECOSYSTEM'
GROUP BY affected_name, affected_ecosystem
ORDER BY count(*) DESC
LIMIT 10

PyPI

Chart showing the number of advisories by package in the PyPI ecosystem

Maven

Chart showing the number of advisories by package in the Maven ecosystem

npm

Chart showing the number of advisories by package in the npm ecosystem

Packagist

Chart showing the number of advisories by package in the Packagist ecosystem

NuGet

Chart showing the number of advisories by package in the NuGet ecosystem

Go

Chart showing the number of advisories by package in Go ecosystem

RubyGems

Chart showing the number of advisories by package in RubyGems ecosystem

crates.io

Chart showing the number of advisories by package in crates.io ecosystem

Next Steps

This has been a high level view of all the advisories found in a specific GitHub-maintained public database. To examine the advisories that impact your organization or team, you'd want to join the data in this repository with information about what packages your code brings in - potentially by using SBOMs or even parsing package manifests.

Tools such as Dependabot already do this for the GitHub ecosystem, and automate the maintenance of dependencies as well. There are, however, other databases and ecosystems emerging that track advisories and vulnerabilities. MergeStat supports some of these tools today, and we are working to make it possible for anyone to easily bring the output of their own selection of tools in. We believe the easier it is to access data involved in key aspects of the software-supply-chain, the more secure and the more effective engineering organizations may be.

Join our Slack

Our community Slack is a great place to find help and ask questions. We're always happy to chat about MergeStat there 🎉!

Patrick DeVivo

Recently, MergeStat added support for collecting data from GitHub Actions. We wanted a way to start asking questions about our CI pipelines, and very soon we were able to leverage MergeStat to surface useful results.

Finding Our Most Expensive CI Pipelines

Last year we received a GitHub bill that surprised us. We had an expensive charge related to GitHub Actions minutes, even though most of our repos are public (Actions usage is free for public repos). We ended up finding a couple of experimental workflows in private repos that were the culprits of the higher-than-usual costs.

To find these, we exported our raw Actions usage data into a spreadsheet, aggregated the minutes, and ordered by the most expensive repos. This wasn't too difficult, but it made us think about how valuable it could be to always have this data on hand, with the ability to query it ad-hoc (vs needing to run an export, load a spreadsheet and run some formulas every time).

Now that we have GitHub Actions data syncing with MergeStat, we're able to do this:

-- find our longest running CI jobs
SELECT
EXTRACT(EPOCH FROM (public.github_actions_workflow_runs.updated_at - public.github_actions_workflow_runs.run_started_at))::integer/60 AS minutes_to_run,
public.repos.repo,
public.github_actions_workflow_runs.*
FROM public.github_actions_workflow_runs
INNER JOIN public.repos ON public.github_actions_workflow_runs.repo_id = public.repos.id
ORDER BY 1 DESC

Screenshot of SQL query for finding long running GitHub Actions in the MergeStat app

Improving DevEx by Finding Long Running Tests

In a very related use case, a partner reached out asking how to use MergeStat to query for long running tests. Long running tests can be a significant bottleneck in a software-delivery pipeline, especially at scale. This impacts developer experience and the rate at which teams can deliver value to production.

We were able to tweak the query above to answer this question. In short, we filtered out workflow runs that had a name that included the string test, which was good enough for the situation at hand:

SELECT 
EXTRACT(EPOCH FROM (public.github_actions_workflow_runs.updated_at - public.github_actions_workflow_runs.run_started_at))::integer/60 AS minutes_to_run,
public.repos.repo,
public.github_actions_workflow_runs.*
FROM public.github_actions_workflow_runs
INNER JOIN public.repos ON public.github_actions_workflow_runs.repo_id = public.repos.id
WHERE public.github_actions_workflow_runs.name ilike '%test%'
ORDER BY 1 DESC

Next Up

These two examples hopefully convey the value of having this type of CI/CD data on hand and accessible with SQL. Since this data can sit next to pull requests, commits, code, issues and more, we can augment these queries with additional dimensions to get deeper insights into engineering operations overall.

In addition, we're working on some exciting features that will make accessing and using this data much easier. In particular, saved queries, charts, dashboards, reports and alerts will make it possible to use this data more effectively.

  • Visualize which repos or teams are using the most CI minutes.
  • Send a Slack alert when a CI run takes longer than expected (configurable).
  • Track improvements in CI runtimes over different periods and teams, use it to celebrate or communicate up.

Regardless, MergeStat's mission continues to be in service of data agility for software engineering. Check us out!

Join our Slack

Our community Slack is a great place to find help and ask questions. We're always happy to chat about MergeStat there 🎉!

Patrick DeVivo

The GIF on our landing page shows a SQL query executing in a MergeStat application:

GIF showing a query surfacing Go mod versions

If you look closely, you'll notice that the query has something to do with go.mod files. In particular, it's this query:

-- Go version counts across all repos
SELECT
SUBSTRING(git_files.contents FROM 'go ([0-9]+.[0-9]+)') AS dependencies_go_version,
COUNT(1) AS version_count
FROM git_files
INNER JOIN repos ON repos.id = git_files.repo_id
WHERE git_files.path LIKE '%go.mod' AND SUBSTRING(git_files.contents FROM 'go ([0-9]+.[0-9]+)') IS NOT NULL
GROUP BY dependencies_go_version
ORDER BY version_count DESC

which parses out the go directive in any go.mod file it finds, looking for the declared Go version.

A go directive indicates that a module was written assuming the semantics of a given version of Go. The version must be a valid Go release version: a positive integer followed by a dot and a non-negative integer (for example, 1.9, 1.14).

Why?

Cool - but how is this useful? The value we are trying to convey in this query is MergeStat's ability to surface data across many Git repositories. This in particular should resonate with anyone who's worked on a team responsible for lots of codebases across an organization: DevEx, DevSecOps, Platform, etc.

Aggregating Go versions across many repos is useful in ensuring a consistent experience for Go developers. This may be important for an internal DevEx or Platform team to understand, or for any one responsible for the maintenance of many open-source, public Go projects.

It could serve as a proxy measure for how "up to date" codebases are, whether they are able to support the latest features of the language. For instance, Generics were introduced in 1.18, and it may be important to know how much of your Go source code is able to make use of them by looking at go.mod files.

Looking at Public HashiCorp go.mod Files

Let's take a look at the go.mod files in some public Git repos. HashiCorp is famously a large Go shop, and many of their core projects are in Go - so let's take a look at all their public repos!

Here's how I used MergeStat to do so:

Run MergeStat

First, I grabbed a server from our friends at Equinix Metal. I intend to use the MergeStat docker-compose set-up, outlined here.

I ssh into my new server and run the following:

git clone https://github.com/mergestat/mergestat
cd mergestat
docker-compose up

This brings up an instance of MergeStat on port :3300 on the IP of my new server, where I can login with the default credentials postgres and password.

Setup Repos & Syncs

Next, I add a GitHub PAT so that I can:

  1. Add a repo auto import for the hashicorp GitHub organization
  2. Use the GITHUB_REPO_METADATA sync type (the GIT_FILES sync does not require GitHub authentication, since it uses the native Git protocol)

Screenshot of adding a repo auto import

I make sure to enable the GitHub Repo Metadata and Git Files sync types.

Screenshot of the repo auto import once added

Now, the file contents and metadata from the GitHub API should begin syncing for all public HashiCorp repos 🎉. I can run this query to keep track of the initial sync:

SELECT count(*) FROM mergestat.repo_syncs WHERE last_completed_repo_sync_queue_id IS NULL

Once the result is 0, I'll know that the first run for all the syncs I've defined are complete.

Executing Queries

Once the initial data sync is complete, I can start executing some queries. Let's start by identifying how many of the 977 repos are identified as Go repos (by GitHub):

SELECT count(*), primary_language FROM github_repo_info
GROUP BY primary_language
ORDER BY count(*) DESC

Chart of HashiCorp repos by language

Looks like 431 are picked up as Go codebases.

Next, let's run the original query from above, but with a small amendment. I'll change the LIKE '%go.mod' to LIKE 'go.mod', to only identify go.mod files in the root of a repo. This avoids picking up vendored Go modules.

HashiCorp Go versions

And there you have it! Looks like most public HashiCorp repos are on 1.18.

You may notice that the sum of all repos in this query is 390, not 431. This is likely because not all Go repos have a go.mod file.

Operationalize It

Because MergeStat makes use of PostgreSQL, queries like this can be hooked up to BI tools and internal dashboards. This could be a useful way to track a migration effort, for instance, or alert on when a repo begins using a "non-standard" version of Go for your organization.

Further, these queries data can be augmented with commit and team data, to add additional dimensions.

Join our Slack

Our community Slack is a great place to find help and ask questions. We're always happy to chat about MergeStat there 🎉!

Patrick DeVivo

Recently, I came across this tweet from Nicolas Carlo:

Nicolas Carlo tweet about finding hotspots in a git repo

Finding hotspots in a (git) codebase can be surfaced with the following:

git log --format=format: --name-only --since=12.month \
| egrep -v '^$' \
| sort \
| uniq -c \
| sort -nr \
| head -50

This defines hotspots as the files most frequently modified in the last year (by number of commits).

This bash script looks a lot like what both MergeStat and MergeStat Lite can surface, but using SQL 🎉!

MergeStat Example

MergeStat can be used to surface this list as well:

select file_path, count(*)
from git_commits join git_commit_stats on (git_commits.repo_id = git_commit_stats.repo_id and git_commits.hash = git_commit_stats.commit_hash)
join repos on git_commits.repo_id = repos.id
where repo like '%mergestat/mergestat' -- limit to a specific repo
and git_commits.parents < 2 -- ignore merge commits
and author_when > now() - '1 year'::interval
group by file_path
order by count(*) desc
limit 50

Screenshot of MergeStat Example

MergeStat Lite Example

MergeStat Lite (our CLI) can be run against a git repo on disk to surface the same set of file paths:

select
file_path, count(*)
from commits, stats('', commits.hash)
where commits.author_when > date('now', '-12 month')
and commits.parents < 2 -- ignore merge commits
group by file_path
order by count(*) desc
limit 50

Screenshot of MergeStat Lite Example

Why bother?

As Nicolas Carlo points out, identifying hotspots in a codebase is an effective way to determine which files are worth examining as candidates for a refactor.

The SQL queries above can be modified to better suit your needs. For example:

  • Filter for particular file types by extension (maybe you only care about hotspots in .go files, for example)
  • Filter out particular directories
  • Modify the time frame
  • Surface hotspots across multiple repositories
  • Filter hotspots based on authors

Patrick DeVivo

We’re proud to announce that MergeStat has raised over $1.2m in pre-seed funding led by OSS Capital, with participation from Caffeinated Capital and prominent angel investors.

At MergeStat, our mission is to enable operational analytics for software engineering teams via powerful, open-source tooling and systems.

We believe there is tremendous value in connecting SQL with the systems used to build and ship software. Engineering organizations are often “black boxes” driven by intuition and gut-feel decisions. By enabling access to the processes and artifacts of software engineering as data, MergeStat helps organizations become data-driven in the ways most relevant to their needs.

Our PostgreSQL approach is based on applying SQL to the data sources involved in building and shipping software. SQL not only grants the ability to ask adhoc questions, but also brings compatibility with many BI, visualization, and data platforms.

We’re working with a variety of organizations using MergeStat to answer questions about the software-development-lifecycle, in the tools they prefer. To date, we’ve worked with teams using our SQL approach to answer questions around:

  • Audit and compliance
  • Code and dependency version sprawl
  • Engineering metrics and transparency (DORA metrics)
  • Code pattern monitoring and reporting
  • Developer on-boarding
  • Vulnerability reporting
  • …and more

“MergeStat is bringing the lingua franca of data to code: applying SQL to the modern SDLC will unlock tremendous value for all software developers. We are greatly honored to partner with Patrick DeVivo on this important mission!”

– Joseph Jacks, Founder and General Partner at OSS Capital

Over the past year, MergeStat has grown into an amazing team with a growing open-source presence. We’re very excited for our next chapter, as we begin working with more organizations looking to answer questions about how their engineering teams operate.

Investors

Patrick DeVivo

If you’ve spent any time around code, you’ll know that // TODO comments are a fact of life. They're a common pattern, regardless of how you feel about them! For instance, the Kubernetes codebase has over 2,000, and Linux has over 3,000.

In the MergeStat codebase, we use them as a low-effort way to track small, technical debt items. Sometimes, a future fix or refactor might not warrant a ticket (it’s too small and too specific to a piece of implementation detail), but it’s still worth making a note. TODO comments are a good fit for this because they are:

  • Low effort - very easy to add and remove, just leave a comment in the code
  • Safe from context switching - no need to switch into a ticketing system, stay in the editor and near the relevant code
  • Tracked in version control - so you have a history and audit trail

We recently connected with Ivan Smirnov, CTO of Elude on this topic, and were excited to learn about his enthusiasm for tracking TODO comments 🙂. He shared that during his time at Google, there was an internal system which aggregated TODOs across codebases, as a way of surfacing parts of code worth returning to. He missed having a similar solution in his role at Elude.

Luckily, we were able to help with a MergeStat + Grafana based solution! Elude operates a self-hosted instance of MergeStat (using our Kubernetes helm chart), and connects to its PostgreSQL database with a Grafana instance. We collaborated on putting together a starting “TODO Tracker” dashboard, which is available in our examples as a Grafana export:

Screenshot of Grafana board tracking TODOs

"Elude currently uses TODO comments as a low friction mechanism to track technical debt. MergeStat is the missing link that allows us to turn these comments into trackable, actionable tasks." – Ivan Smirnov, Elude CTO

The SQL involved looks something like this:


SELECT
git_blame.line,
git_blame.author_name,
git_blame.author_email,
git_blame.author_when,
REPLACE(repos.repo, 'https://github.com/', '') AS repo,
repos.repo || '/blob/main/' || git_blame.path || '#L' || git_blame.line_no AS url -- generate a link to the line in GitHub
FROM git_blame
INNER JOIN repos ON repos.id = git_blame.repo_id
WHERE git_blame.line LIKE '%TODO%'
ORDER BY git_blame.author_when ASC

and should be fairly easy to customize to different needs:

  • Only apply to certain repos
  • Filter out certain file paths by pattern
  • Look for FIXME and BUG comments as well
  • Parse out "assignees" (i.e. TODO(patrickdevivo))
  • etc...

If you're interested in taking a look at your own // TODO comments, go ahead and try out a local instance of MergeStat!

Join our Slack

Our community Slack is a great place to find help and ask questions. We're always happy to chat about MergeStat there 🎉!

Patrick DeVivo

Today we're excited to announce the availability of in-app SQL querying in the latest versions of MergeStat! 🎉

Illustration of the Query UI

One of the more significant pain points noted by our early adopters has been the need for external tools to access the data MergeStat provides, even for simple, one-off queries. Many users (ourselves included) lean on existing data products such as Grafana, Metabase and Superset to consume MergeStat data (in dashboards, alerts and reports).

With the addition of our query interface (in the Queries tab of our management console), MergeStat users can now execute SQL directly in our app.

Query results can be copied or downloaded as CSV or JSON, for quick use in other tools and contexts. We believe this is a significant step-forward in our app's functionality, and will continue to invest in this area of our management console. Keep a lookout for additional features, including:

  • Saved and examples queries
  • Inline schema documentation and editor auto-completions
  • Basic charting and data visualization
  • Query execution history

It's important to note that as always, the MergeStat PostgreSQL database can be connected directly to by BI tools, desktop SQL clients, or SQL drivers.

Check out the latest MergeStat release to get started!

Join our Slack

Our community Slack is a great place to find help and ask questions. We're always happy to chat about MergeStat there 🎉!

Patrick DeVivo

Today we're very happy to announce a new flavor of MergeStat! If you've been following our progress over the last year, you'll know that our mission is to enable operational analytics for software engineering teams. You'll also know that our approach has been heavily based on SQLite (and its virtual table mechanism) to bring data from git repositories (source code, metadata, the GitHub API, etc) into a SQL context for flexible querying and analytics.

MergeStat Management Console Illustration

This has enabled initial use cases in many interesting domains related to the software-development-lifecycle, from audit and compliance, to code querying, to release time metrics, to technical debt surfacing, and much, much more.

For the past several months, we’ve been working on an approach in service of this mission that uses a different mechanism for enabling that SQL context. That mechanism is based on syncing data into a Postgres database for downstream querying, vs using a local SQLite based approach.

This grants us two significant advantages:

  1. More compatibility with the ecosystem of data (and BI/visualization) tools
  2. Much faster query time for data spread across multiple API sources

More Compatibility

We love SQLite, but the fact of the matter is that it’s much easier to integrate a data visualization or BI product (open-source or not) with a Postgres server (or Postgres compatible server) than with a SQLite database file. A central part of our mission has always been not just enabling SQL, but allowing our SQL solution to play well with the wide array of existing tools that companies, teams and individuals are already using.

We want anyone to be able to query MergeStat data from tools like Metabase, Grafana, Tableau, Superset, etc. Postgres compatibility takes us a step in that direction, and we’re already working with early users integrating their SDLC data with these types of tools, via MergeStat.

Faster Queries

Our SQLite virtual-table based approach is an effective way to query a local data source (such as a git repository on disk). However, it begins to fall short when it comes to querying over large sets of data spread across many pages in a web API (or multiple APIs). What ends up happening is queries spend much more time waiting for HTTP requests to finish than actually executing SQL. This means at query time, the user is forced to wait for data collection to occur. Depending on the scope of the data involved, this can potentially take a very long time. With our new approach, data is synced and maintained in a background process, so that data collection (from potentially slow sources) occurs out-of-band from user queries.

What’s Next?

Our SQLite approach isn’t going anywhere. We still intend to invest in that and continue building it into a valuable open-source CLI that anyone can use. It’s been renamed MergeStat Lite and now lives at mergestat/mergestat-lite.

Our new approach now lives at mergestat/mergestat. Our documentation has been updated to reflect these changes, and we couldn’t be more excited to share more in the coming days and weeks.

We have some great features planned, and will be spending more time showcasing various use-cases from our growing community.

Join our Slack

As usual, our community Slack is a great place to find help and ask questions. We're always happy to chat about MergeStat there 🎉!